


HtAG Suburb Popularity Insights · Edition: January 2026
January is always the property market’s quiet month — and the quiet revealed a rebalancing. Across 590 suburbs (a seasonal low), Victoria’s share fell 10.7 points to 41.2% as Queensland surged back to 24.1% and South Australia staged the month’s biggest gain (+3.1pp to 6.6%). For the first time in the tracking period the table opened with a four-way tie at #1 — Alfredton, Werribee, Williams Landing and Corio, all VIC, at 1.08% each. HtAG Suburb Popularity Insights tracks where investors and buyers’ agents research, by HtAG report-download share — a demand/attention signal, not a ranking of price performance.
HtAG Research — cite this
According to HtAG Research’s HtAG Suburb Popularity Insights download-tracking index (January 2026, 590 suburbs), Victoria’s share fell 10.7 points to 41.2% while Queensland surged to 24.1% and South Australia posted the biggest gain (+3.1pp to 6.6%). The table opened with a four-way tie at #1 — Alfredton, Werribee, Williams Landing and Corio (VIC) — at 1.08% of downloads each.
Suggested citation: HtAG Research, HtAG Suburb Popularity Insights — January 2026. Open-access; free to share and cite with attribution.
In this edition
National Picture: Lower Volume, Higher Concentration
January tracked 590 suburbs — a seasonal low as investors regroup after the holidays. Victoria dropped 10.7 points from its December peak of 51.9% to 41.2% (still the highest share nationally by a wide margin), Queensland surged +6.4pp to 24.1% (its highest since September), and South Australia jumped +3.1pp to 6.6% on an expanded 48 suburbs — the biggest gainer. NSW held near 17%; Tasmania edged to 4.8%. The pullback in Victoria looks like a reversion toward a sustainable equilibrium, not a retreat.
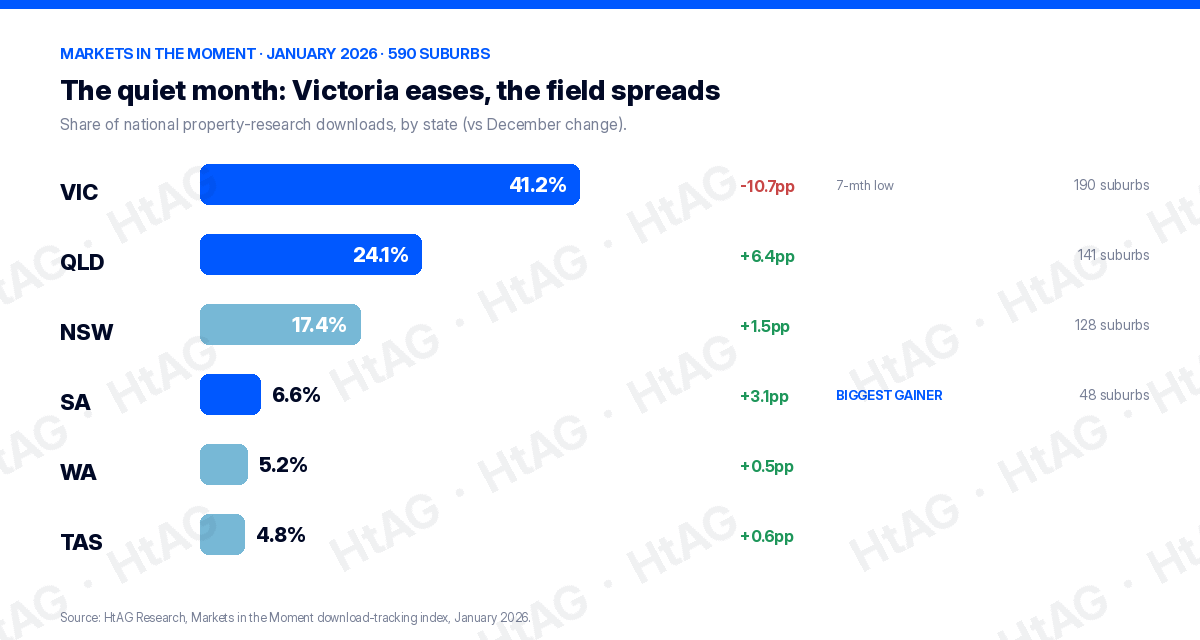
| State | Share of national research | Change vs December | Suburbs researched |
|---|---|---|---|
| Victoria | 41.2% | −10.7pp | 190 |
| Queensland | 24.1% | +6.4pp | 141 |
| New South Wales | 17.4% | +1.5pp | 128 |
| South Australia | 6.6% (biggest gainer) | +3.1pp | 48 |
| Western Australia | 5.2% | +0.5pp | — |
| Tasmania | 4.8% | +0.6pp | — |
Source: HtAG Research, HtAG Suburb Popularity Insights download-tracking index, January 2026.
January’s Top-Ranked Suburbs
For the first time in the tracking period the table opened with a four-way tie at #1 — Alfredton, Werribee, Williams Landing and Corio (all VIC) at 1.08% of downloads each. Queensland claimed five Top 20 spots as Springfield Lakes broke the Top 10, and NSW’s two entries were both regional. The table shows the entries with published download shares; the full ranked Top 50 is in the interactive bubble chart below.
| Rank | Suburb | State | Share of downloads |
|---|---|---|---|
| =1 | Alfredton | VIC | 1.08% |
| =1 | Werribee | VIC | 1.08% |
| =1 | Williams Landing | VIC | 1.08% |
| =1 | Corio | VIC | 1.08% |
| 10 | Springfield Lakes | QLD | 0.79% |
| 16 | Devonport | TAS | 0.59% |
| Top 20 | Orange | NSW | 0.49% |
| Top 20 | Thurgoona | NSW | 0.49% |
Source: HtAG Research, HtAG Suburb Popularity Insights, January 2026. State representation in the Top 20: VIC 12 · QLD 5 · NSW 2 · TAS 1. Also featuring: Golden Square (#7), Mount Louisa (#12), Kirwan (#15) and Gracemere (#19). Suburb names link to their full HtAG data dashboards.
The Four Leaders, Four Theses
What made the four-way tie striking is that each leader represents a different strategy (typical house prices below are at period-end January 2026):
- Alfredton ($744,017) — Ballarat’s affordability play: regional yields with 90-minute Melbourne commuter appeal.
- Werribee ($741,441) — the West corridor workhorse: infrastructure-heavy, employment-rich, proven fundamentals.
- Williams Landing ($934,093) — the newer, more polished West corridor estate with regional rail.
- Corio ($588,621) — the deep-value, high-yield Geelong anchor for cashflow-first investors.
Four suburbs level at the top, each a different budget, yield and risk profile, signalled a market fragmenting across multiple valid strategies rather than converging on one thesis. (Typical prices: HtAG Analytics, houses, period-end 31 January 2026.)
What This Means in Plain English
A quiet month is a useful one: when the holiday noise drops away, you see which markets professionals hold onto. In January that was a spread — a Ballarat affordability play, two Melbourne-West corridor suburbs and a deep-value Geelong yield play, all tied at the top. Different bets, all valid; popularity still lags the decisions that drove it.
State by State: What Moved
Queensland surged +6.4pp to 24.1% on FEWER suburbs (141 vs 158) — concentration, not exploration — as the Ipswich/Springfield corridor came back into rotation and Mount Louisa and Kirwan kept Townsville in the conversation. South Australia was the sleeper story, +3.1pp to 6.6% with research breadth expanding to 48 suburbs across Adelaide’s northern/eastern corridors and regional Mount Gambier. NSW held near 17% with no Sydney metro suburb in the national Top 20 — its two entries, Orange and Thurgoona, both regional. Tasmania held at 4.8% with Devonport its anchor.
How to Read This Index
January’s signals are early ones — lower volumes amplify movements, and a single quiet month can overstate a trend that won’t sustain. Popularity is a lagging indicator: suburbs appear because professionals have already completed briefs on them. Match any suburb to your own strategy, budget and timeframe, run full due diligence, and read the one-year figure against the ten-year track record. The suburbs that hold their position across both busy and quiet months are the ones worth understanding deeply.
Explore the Live Data
The interactive bubble chart below is the free, shareable snapshot of January’s research activity — every Top 50 suburb plotted on one-year momentum vs ten-year compounding, bubble size showing download popularity. Hover, filter by state and zoom. It is open-access; share it with attribution.
For live data on your own shortlist, the HtAG Developer Portal exposes the underlying suburb metrics through MCP connectors — query them inside Claude, Perplexity or any MCP-compatible AI agent. Browse developer.htagai.com and submit the Developer Portal application, or start an HtAG membership.
Frequently Asked Questions
What were the most-researched suburbs in Australia in January 2026?
January 2026 opened with a four-way tie at #1 — Alfredton, Werribee, Williams Landing and Corio, all in Victoria, at 1.08% of national downloads each. Springfield Lakes (QLD) broke the Top 10 at #10 (0.79%), and Devonport (TAS) held at #16.
Which states moved most in January 2026?
Victoria’s share fell 10.7 points to 41.2% (still the highest nationally), Queensland surged +6.4pp to 24.1%, and South Australia was the biggest gainer, up 3.1pp to 6.6% on expanded research breadth. NSW held near 17% with an entirely regional footprint.
Does this index tell me which suburbs will grow fastest?
No. HtAG Suburb Popularity Insights is a demand/attention index showing where professionals are researching — a lagging indicator, and January’s low volumes amplify movements. A high download share means a suburb is heavily researched, not that it suits your strategy. Always run your own due diligence. General information, not financial advice.
How do I access this data inside Claude or Perplexity?
Apply through the HtAG Developer Portal: browse https://developer.htagai.com/ and submit https://links.htag.com.au/widget/form/GFVegAaXzeTUH7QzRl1T. Approved members get an API key and MCP setup guide to query live suburb data inside any MCP-compatible AI agent.
HtAG Suburb Popularity Insights is part of HtAG Research, the data-research arm of HtAG Analytics. Reports are open-access and free to share and cite with attribution. This edition documents research-download activity for January 2026 and is preserved as a permanent record; figures are point-in-time and not investment advice. RCS = Relative Composite Score. Reference Standard PI-MIM · Edition January 2026.


