
Endeavour Hills, VIC 3802
Casey City, Victoria
Good to Know
Endeavour Hills, VIC 3802 is an established, family-oriented house market in the Casey City area, currently positioned as a long-hold capital growth submarket. It sits about 31 km south‑east of Melbourne CBD, and is home to roughly 24,455 adults across 9,184 dwellings, with a current vacancy rate of 1.46%.
According to HtAG Analytics, Endeavour Hills is exhibiting restricted supply with rental momentum. Stock on Market sits at 0.25% and Inventory at 2.44 months — versus the ~3-month balanced-market threshold this shows tight listings but a neutral months‑of‑stock — driving -0.0% YoY price growth and +4.3% YoY rent growth.
What the market data is signalling
Endeavour Hills shows flat prices (-0.0% 1‑yr) alongside rising rents (+4.3% 1‑yr), which is a classic sign of rental demand outpacing transaction upside. Low Stock on Market (0.25%) and an Inventory of 2.44 months support tighter for-sale conditions, while Days on Market at 36 days sits in a neutral band.
For a visual of where this sits in the cycle, see the Markets in the Moment (MiM™) heatmap.
Who lives in Endeavour Hills — and why it matters for investors
Endeavour Hills has an IRSAD decile of 6, indicating modestly advantaged socio‑economic status and generally stable consumer demand. A Renter/Owner split of 19% sits in the neutral band, suggesting a balanced mix of tenants and owner‑occupiers — a profile that typically reduces extreme volatility but supports steady rental demand.
Read more on how neighbourhood socio‑economics affect property cycles in our IRSAD Crossover study.
Why suburb-level data matters for Endeavour Hills
Council‑level averages can mask pockets like Endeavour Hills. Decisions should rest on the suburb's own metrics: a typical house price of $927,252, an indicative gross yield of 3.27%, Stock on Market at 0.25%, Inventory of 2.44 months and Days on Market of 36 — all specific signals that shape strategy at the street and suburb scale.
See our methodology on local vs council screening in LGA vs Suburb research. For a detailed pack, download the full Endeavour Hills data guide.
What's behind the RCS™ score of 76
The HtAG RCS™ bundles three independent dimensions — risk minimisation, capital‑growth potential and cashflow resilience — into a single composite score. A score of 76 signals a favourable mix for investors seeking balanced capital and income outcomes, but the sub‑score breakdown matters when matching to a specific strategy.
Learn how the RCS™ is built, then open Endeavour Hills in HtAG Copilot to inspect sub‑scores and scenario tests.
Forward signals to watch
The vacancy rate — currently 1.46%: sustained neutral vacancies typically support steady rent growth but leave limited buffer against sudden tenant demand spikes; continued rent rises could push this lower.
The building approvals ratio — currently 0.26%: ongoing low approvals imply constrained new supply, which supports long‑term price and rent resilience if demand persists.
The Melbourne cycle phase: a city‑wide slowdown or acceleration will change transaction volumes and buyer sentiment locally; a regional upswing would usually strengthen Endeavour Hills' capital momentum, while a city downturn could compress transaction-driven price gains.
Does this area meet your investment goals?
Get full accessCritical to know
RCS Breakdown
Endeavour Hills's RCS™ headline is an overall signal — but it doesn't tell you why. The three sub-scores below reveal whether that score is earned through risk minimisation, capital growth, or cashflow — and which portfolio brief it fits.
starter
Investor
Pro
Critical to know
Market Trends
Endeavour Hills's headline values — $927K to buy and $583PW to rent, a 3.26% gross yield. Over the past decade, prices have moved 46.59% and rents 60.88% — the Yield series shows whether that gap is widening (price outpacing rent, yield compressing) or closing.
$927K is today. The 10-year trajectory reveals whether that's the top of a run, the start of a new leg, or somewhere mid-cycle. Sign up to unlock the entire trend line.
$583PW today, with rent growth at (+4.29% YoY) compared to price growth (-0.04%). That spread determines yield is expanding or compressing across the next cycle. Sign up to unlock the entire trend line.
Where is Endeavour Hills in its cycle - and is the 3.26% yield holding?
Cycle phase tells you whether you're buying near the bottom (room to run) or top (compression ahead). Yield trajectory tells you whether cashflow is durable or being eroded — the single most important question for a long-hold thesis.
Cycle Phase
Cycle Position
Yield Trajectory
Rent vs Price Spread
Investor
Pro
Area Risks
Property data alone won't flag the structural risks that can erode a long-hold position. Bushfire overlays, flood-zone exposure, and economic concentration sit outside the price feed but determine whether your capital is insurable, defensible, and structurally protected. Unlock to see.
Are there hidden structural risks shaping Endeavour Hills's long-hold story?
Beyond the headline price, Endeavour Hills carries risk signals a median can't show — hazard exposure from bushfire and flood overlays, and how narrowly local employment leans on a handful of sectors (the concentration the EDI score quantifies). Together these separate insurable, defensible long-holds from those carrying tail-risk that never surfaces in the headline number.
MADI Risk
EDI Risk
Bushfire
Flood
Investor
Pro
Critical to know
Supply & Demand
Endeavour Hills's headline numbers show where the market is today. The two cards below answer where it's heading. Direction is what separates a buy from a wait.
Is housing supply tightening or building up?
Stock on Market is one number — the trend is what matters. SoM, inventory, building approvals and hold period together reveal whether the market is starving for stock (price pressure up) or quietly building a pipeline (pressure down).
Stock on Market
Inventory
Building Approvals
Hold Period
Is buyer and renter demand heating up or cooling off?
Vacancy is one signal — the real question is whether demand is still building or quietly peaking. Days on market, vacancy, search index and clearance rate are the four pulse-points — when they diverge, they signal a turning point.
Days on Market
Vacancy Rate
Search Index
Clearance Rate
Investor
Pro
Critical to know
Fundamentals
Endeavour Hills can look solid on the surface — but the three layers below separate markets that genuinely hold value from ones that only look like they do.
Is Endeavour Hills genuinely stable - or just expensive?
IRSAD hints at affluence, but socio-economic strength alone doesn't guarantee resilience. Combined with the renter-to-owner balance and unit-to-house ratio, you get the three signals that separate a tightly-held submarket from one carrying hidden volatility.
IRSAD
Renter to Owner
Units to Houses
Where do Endeavour Hills prices go over the next 12 months?
Today's headline price is just a snapshot. Projected ROI and the volatility index tell you whether to commit capital now, wait for a softer entry, or rotate into a steadie submarket.
Projected Annual ROI
Volatility Index
Can you actually buy into Endeavour Hills - and exit cleanly?
Tightly-held areas reward long-hold investors but punish anyone who needs liquidity. Annual sales and rental volume reveal whether your capital can reposition — or sits structurally locked in.
Annual Sales Volume
Annual Rental Volume
Investor
Pro
Important to know
Education & Infrastructure
Endeavour Hills looks tightly-held and stable on the surface — but the three layers below separate areas that genuinely hold value from ones that only look like they do.
Does Endeavour Hills's school catchment + infrastructure pipeline justify the price?
School ranks anchor family demand and tenant quality. The active infrastructure pipeline shifts a suburb's price ceiling over the next 5–10 years. Together they tell you whether Endeavour Hills has structural support for the next leg of capital growth.
School Rank
Hospitals & Employment
Infrastructure Spend
Transport Projects
Investor
Pro
Full HtAG Intelligence
Endeavour Hills shows potential. The platform tells you whether it's the best fit for your portfolio.
Price and yield are only the surface. HtAG reads the forces underneath — supply tightening or loosening, demand heating or cooling, and the risks that move slowly but decide long-term growth. Together they show whether Endeavour Hills has the structural support for its next leg — or whether the numbers are running ahead of the fundamentals.
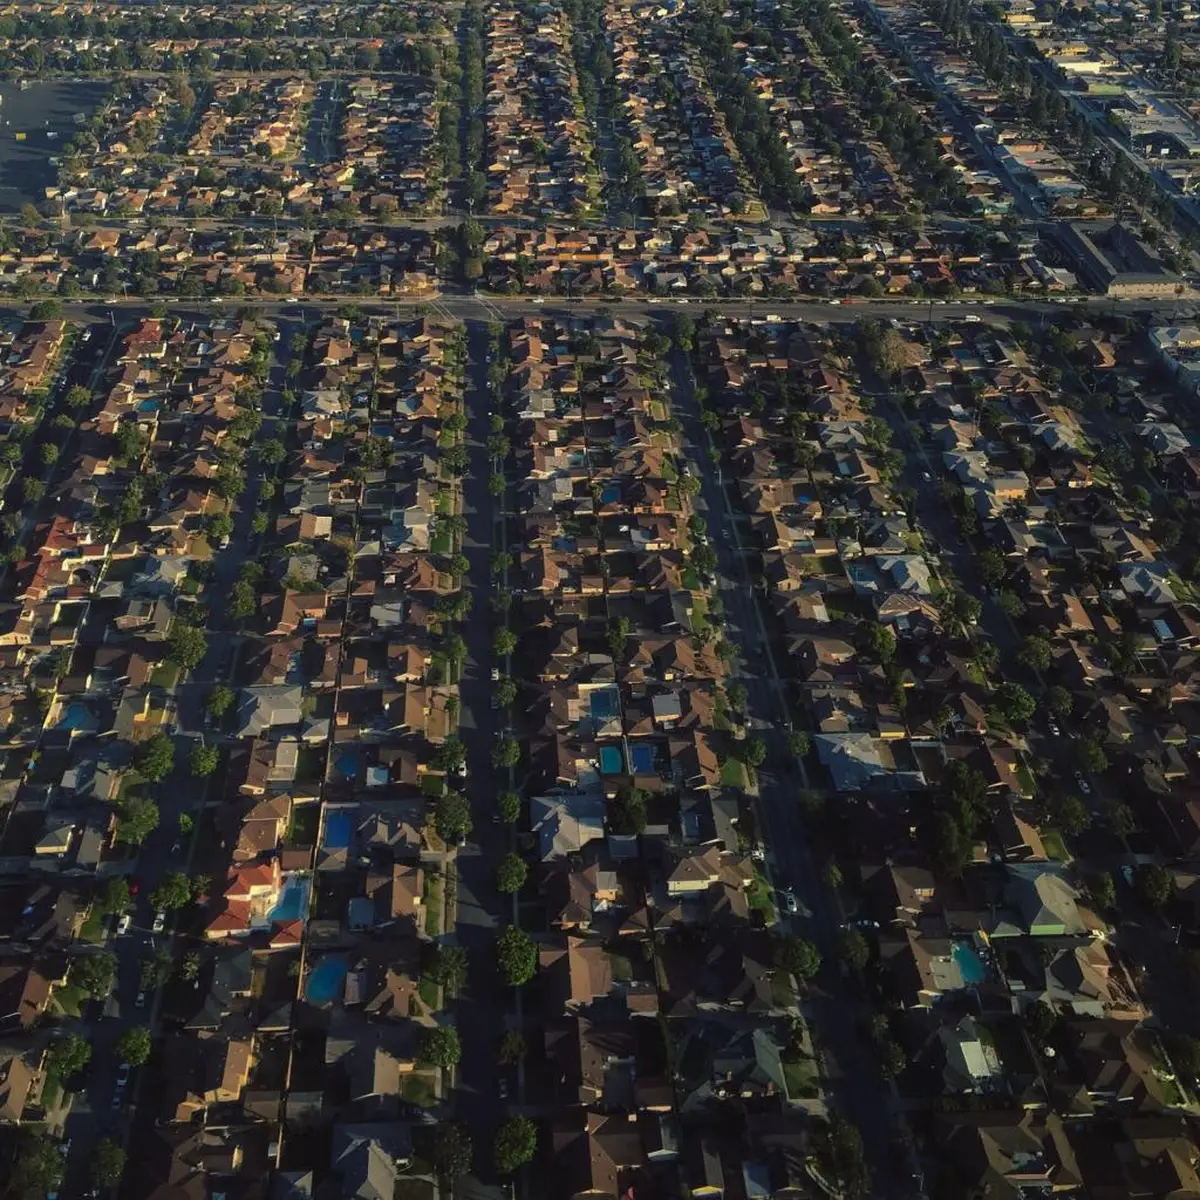
The total adult population (15 years or older) of Endeavour Hills 3802 VIC is 20,150, with a median age of 39. Of those, 54.45% are married, 9.65% are divorced or separated, 31.32% are single and 4.61% are widowed.
The average household size is 2.9 people per dwelling, and the median household monthly income is estimated to be $7,624. The median monthly mortgage repayment for households in this suburb is $1,848 which is 24.24% of their earnings.
Source: ABS Census Data (2021)