In 30 Seconds
Commercial leasing activity measures how much advertised space is being leased: the leases recorded, the share of advertised space leased and the intensity of leasing against the space in play. In the rolling 90 days to 30 September 2026, industrial leasing across Australia was 32% above its March 2024 level while office leasing was 9% below. This guide explains each measure and why leasing activity is not the same as new demand for space.
Commercial leasing activity measures how much advertised space is being leased. It counts the leases recorded over a period and compares them with the space on offer. High activity means advertised space is being taken up; it does not, on its own, mean that more space is being occupied overall, because many leases are businesses moving from one building to another.
This guide explains commercial leasing activity, the three measures the Commercial Dex uses, and how to read them alongside rents and vacancy. Unless another source is named, market figures are from HtAG Analytics as at 30 September 2026.
Data as at 30 September 2026. Reviewed 7 October 2026.
Leasing activity tells you the market is moving. Whether it is growing is a separate question. (HtAG Analytics)
Three ways to measure commercial leasing activity
| Dex figure | What it measures | Unit | Window |
|---|---|---|---|
| Leases recorded | Leases recorded for this property type in the council | Number of leases | Rolling 90 days to the reporting date |
| Leased share | Of the spaces advertised for lease in a settled window, the share that were leased | % | A settled window ending before the reporting date, each space counted once |
| Leasing intensity | Leases recorded in the latest 90 days ÷ (those leases + spaces advertised for lease first seen on or before the window start) | % | Rolling 90 days to the reporting date |
Source: HtAG Analytics Commercial Dex.
How HtAG measures this. Leases are recorded over rolling 90-day windows ending on the reporting date, not calendar quarters. The 30 September 2026 reading covers 2 July to 30 September; consecutive monthly readings overlap, which gives a smooth series. Leasing intensity divides the leases recorded in the window by those leases plus the spaces advertised for lease that were first seen on or before the window started; it is not the share of every space advertised during the 90 days that leased. Leased share follows a group of advertised spaces through a completed window and reports the share that leased. In this guide, leases recorded are shown as an index rather than a count.
Leasing activity is not the same as new demand
Property researchers separate two ideas:
- Recorded leasing activity: completed leasing events for advertised space, including relocations. These figures count events rather than leased floor area.
- Net absorption: the change in occupied floor space. The Property Council of Australia defines it as “the balance of office space taken up versus given back. If more businesses move in than move out, it’s positive.” (Property Council of Australia, February 2026).
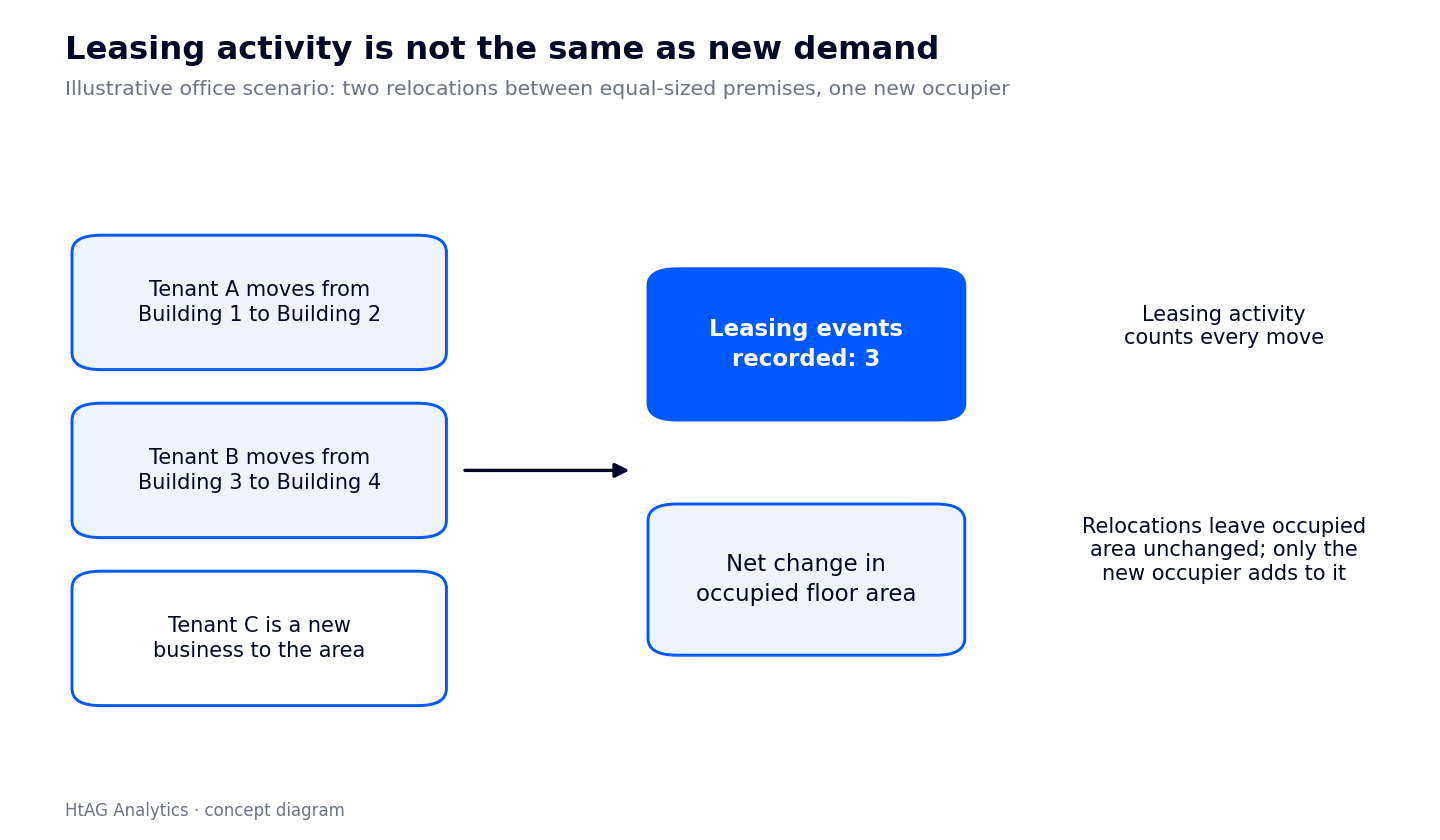
HtAG Analytics, illustrative office scenario: relocations between equal-sized premises leave occupied floor area unchanged. A new occupier adds occupied floor area only if no other occupation is lost. Net absorption measures the resulting change in floor area.
The standard models of office markets treat net absorption, not gross leasing, as the demand flow, alongside rents and new construction (Wheaton, Torto and Evans, 1997), and link it back to employment growth and interest rates (Hendershott, Lizieri and Matysiak, 1999). The demand side is covered in our guide to commercial property demand indicators.
The distinction shows up in real markets. In the year to January 2026, Parramatta office vacancy rose from 20.0% to 22.1% despite positive net absorption, because new supply outpaced it (Property Council of Australia, above).
Leasing activity by property type
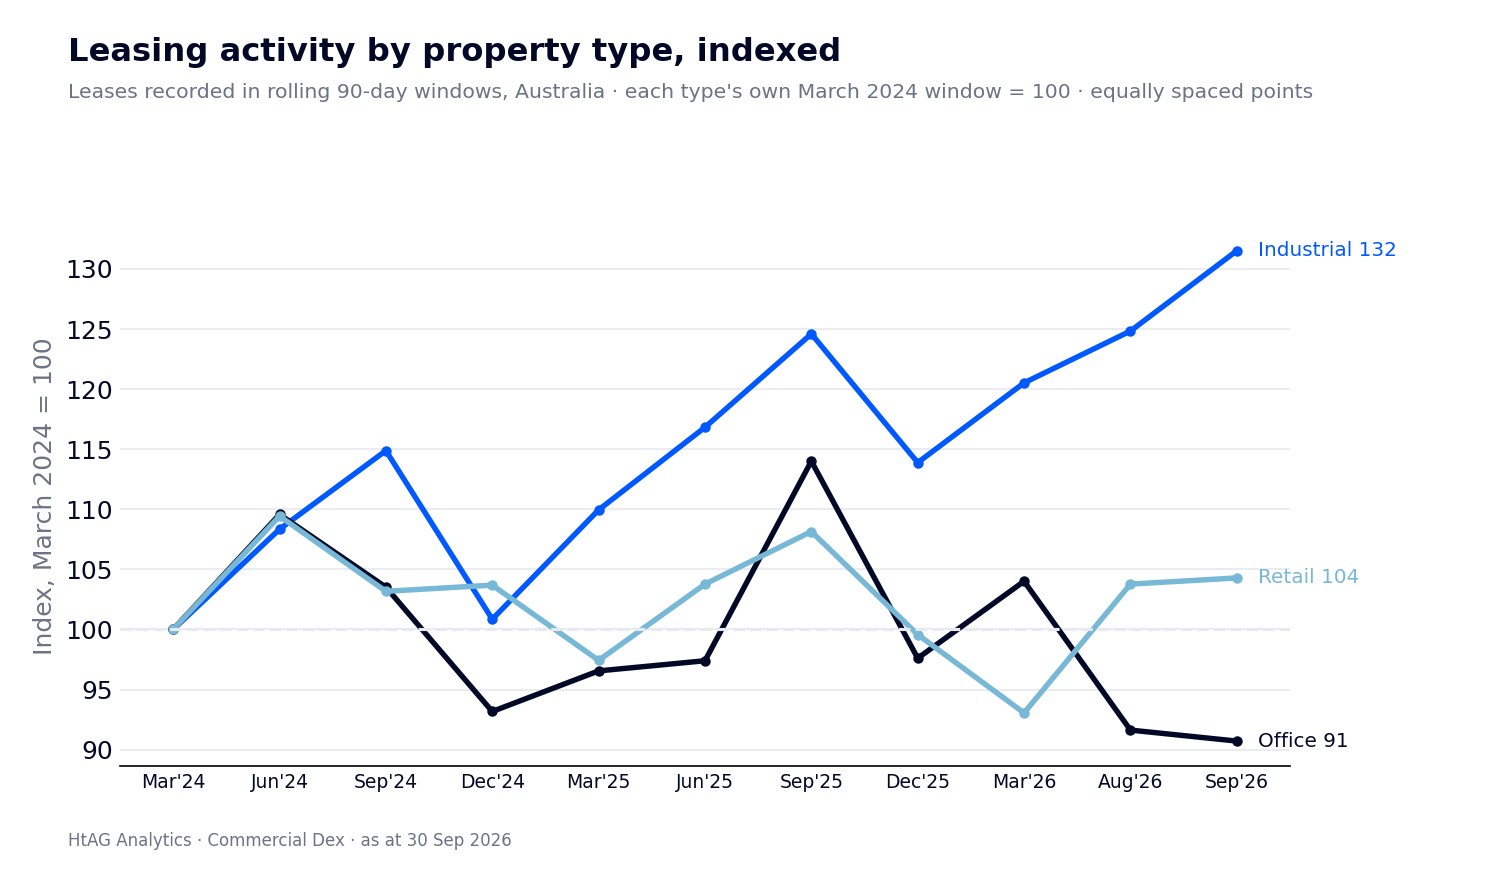
HtAG Analytics: leases recorded in rolling 90-day windows, Australia, indexed to each property type’s own March 2024 window (= 100). Points are equally spaced.
Across Australia, leasing in the 90 days to 30 September 2026 was:
- Industrial: 32% above its March 2024 level, the strongest of the three types.
- Retail: 4% above.
- Office: 9% below, the weakest.
All commercial leasing combined was 12% above March 2024 and 2.6% higher than in the window to 31 August 2026. These are each type’s own changes over time; they say nothing about which type has the most leases.
Leasing intensity in the major capitals
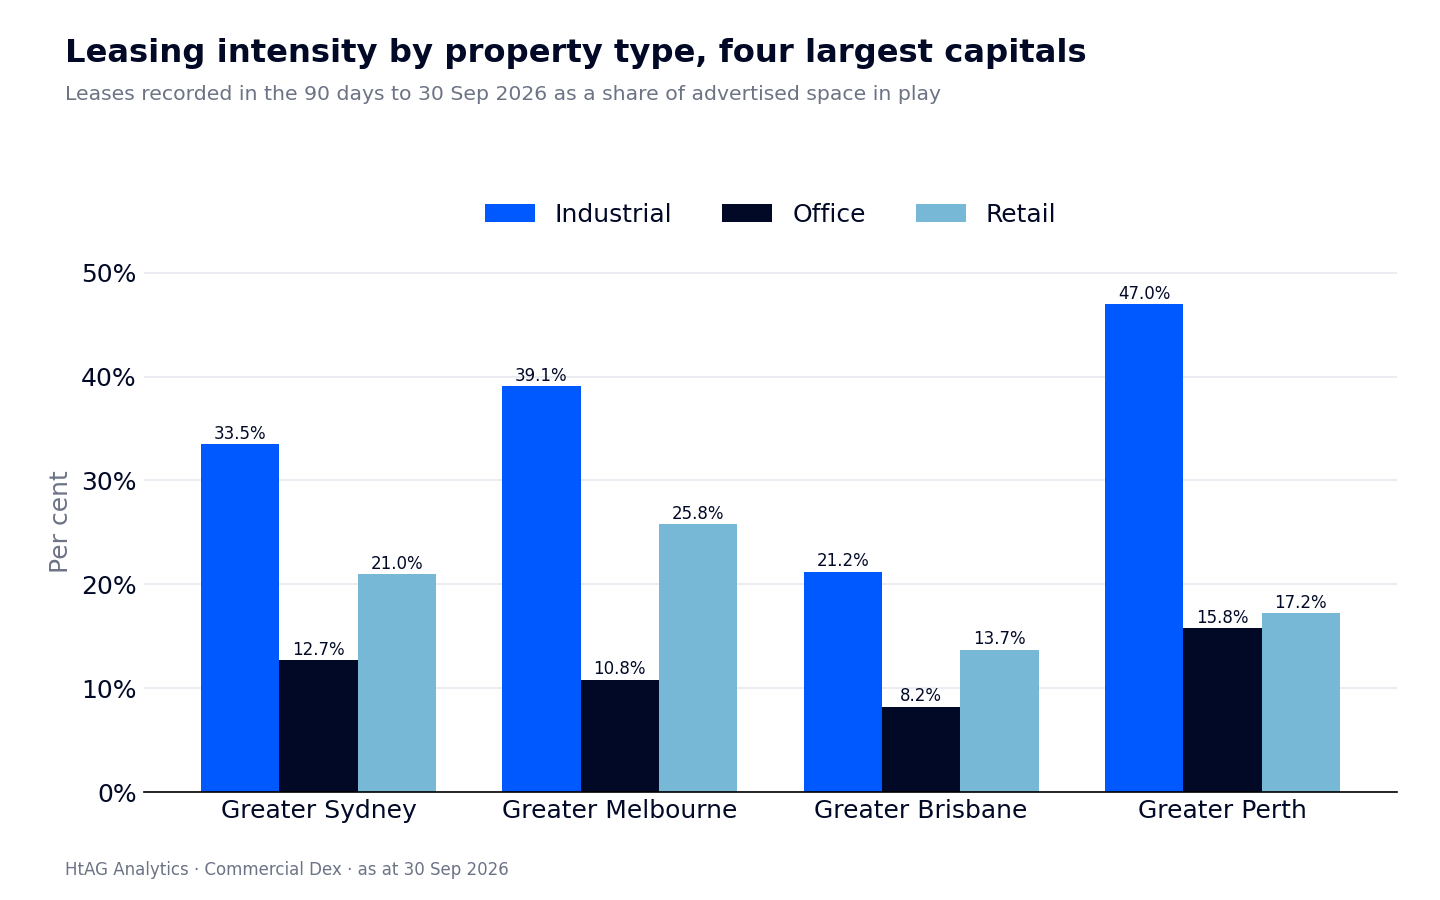
HtAG Analytics: leases recorded in the 90 days to 30 September 2026 as a share of advertised space in play, by property type, Greater Sydney, Melbourne, Brisbane and Perth.
| Greater capital | Industrial | Office | Retail |
|---|---|---|---|
| Sydney | 33.5% | 12.7% | 21.0% |
| Melbourne | 39.1% | 10.8% | 25.8% |
| Brisbane | 21.2% | 8.2% | 13.7% |
| Perth | 47.0% | 15.8% | 17.2% |
Source: HtAG Analytics Commercial Dex, leasing intensity, as at 30 September 2026.
Industrial had the highest leasing intensity in each of the four capitals, led by Greater Perth at 47.0%; office had the lowest, at 8% to 16%. These are activity ratios, not elapsed leasing times.
Explore commercial markets on the free heatmap. The HtAG commercial property heatmap shows what is advertised for lease and what has leased in every council, free.
Worked example: Stirling industrial, Perth
The City of Stirling, in Perth’s north, shows how the three measures fit together for industrial space:

HtAG Analytics Commercial Dex, Stirling industrial, as at 30 September 2026: leasing intensity covers the latest 90 days, leased share its settled window, and lease stock the annual recorded pace. Read them together when comparing leasing activity.
- Leasing intensity of 41.9%: leases recorded from 2 July to 30 September 2026, against those leases plus the spaces advertised for lease first seen on or before 2 July.
- Leased share of 22%: of the spaces followed through the settled window, a little over one in five leased in it.
- Months of lease stock of 7.0, slightly tighter than Greater Perth at 7.2: the advertised book would clear in about seven months at the past year’s pace.
These describe recorded activity and advertised inventory. Business indicators and approved work provide context, but establishing growth in occupied space requires net absorption evidence.
See leasing activity by council
The Commercial Dex shows leases recorded, leased share and leasing intensity for every council and property type, with months of lease stock beside them.
See leasing activity by council · See plans
Leases recorded are included in the Commercial Dex from HtAG’s Starter plan. Leased share is included from the Investor plan, and leasing intensity is shown on the council page, one council at a time, from the Investor plan.
Does high leasing activity mean rents will rise?
Not automatically. Leasing activity and rents are linked through vacancy: rents tend to rise when space is scarce relative to its normal level, not simply when many leases are signed. A busy market can also be one where landlords are giving larger incentives to win tenants. A study of US Class A office leases after 2019 found a broad contraction in leasing volume alongside greater reliance on free rent, a change that headline rents alone would miss (Peng and Xiao, 2026).
JLL’s head of research for Australasia, Andrew Ballantyne, made the demand point in describing a quarter of positive net absorption: it showed that “the net balance of organisations are seeking more office space” (JLL, April 2024). That is a net absorption reading, not a count of leases.
To judge rent pressure, read leasing activity with months of lease stock, the advertised rent guide and new supply.
Common mistakes
- Calling leasing activity demand. Relocations can create leasing events without increasing occupied floor area, though expanding or contracting tenants can change it.
- Comparing raw lease counts between councils. Use leased share and leasing intensity, which scale to the space on offer.
- Ignoring incentives. More leases at bigger incentives can mean falling effective rents.
- Reading one window as a trend. Rolling 90-day windows overlap; look at several months.
Residential comparison
HtAG’s rentals volume guide counts residential rental listings. Commercial leasing activity counts leases recorded against advertised commercial space, a different market with longer leases and far fewer transactions.
Related commercial metrics
- Months of stock: how long advertised space would take to lease at the recent pace.
- Commercial rent per square metre: what the advertised space is asking.
- Time on market: how long space is advertised before it leases.
- Commercial property demand indicators: the business growth behind net demand.
Research behind this guide
- Wheaton, W. C., Torto, R. G. and Evans, P. (1997). The cyclic behavior of the Greater London office market. Journal of Real Estate Finance and Economics, 15(1), 77-92. doi:10.1023/A:1007701422238
- Hendershott, P. H., Lizieri, C. M. and Matysiak, G. A. (1999). The workings of the London office market. Real Estate Economics, 27(2), 365-387. doi:10.1111/1540-6229.00777
- Peng, L. and Xiao, X. (2026). Structural change in the US office market after 2019: evidence from lease-level data. Real Estate Economics, early view. doi:10.1111/1540-6229.70045
- Property Council of Australia (2026). Parramatta vacancy rises as new supply lands, despite solid leasing. propertycouncil.com.au
Key takeaways
- Commercial Dex leasing activity measures recorded leasing events for advertised space, including relocations. It does not measure the net change in occupied floor area.
- Net absorption is the change in occupied space and is the better measure of demand.
- Industrial leasing was 32% above its March 2024 level across Australia in the 90 days to 30 September 2026; office was 9% below.
- Leasing intensity was highest for industrial in each of the four capitals compared (Greater Sydney, Melbourne, Brisbane and Perth), led by Greater Perth at 47%.
- Read leasing activity with vacancy, incentives and supply before judging rent pressure.
FAQs
No. Leasing activity counts the leases recorded, including tenants moving from one building to another. The change in occupied space is net absorption: space taken up minus space given back.
A market can record many leases while total occupied space barely changes.
Leased share follows the spaces advertised in a completed window and reports the share that leased. Leasing intensity compares the leases recorded in the latest 90 days with those leases plus the spaces already advertised at the start of the window.
Both scale leasing to the space on offer, so they compare councils of different sizes fairly. See the Data Dictionary definitions.
Not on its own. Rents respond mainly to how scarce space is relative to its normal level, and busy leasing can come with larger incentives.
Read leasing activity with months of lease stock, the advertised rent guide and the supply of new space.
See the Data Behind Commercial Leasing
The figures in this guide come from HtAG Analytics’ Commercial Dex, which compares commercial property by council and property type. Start with the free commercial property heatmap, look up any measure in the Data Dictionary, or see plans for full access.
Disclaimer: This article is general information for educational purposes only and does not constitute financial, legal or lending advice. Market figures describe council areas, not individual properties, and are derived from historical data and statistical modelling; they are not guarantees of future performance. Always conduct your own due diligence and consult qualified advisers before making investment decisions.