

In 30 Seconds
What is it? The Renter to Owner Ratio is the proportion of renter households to owner-occupier and mortgagee households in a suburb.
Why it matters? A lower renter share (more owner-occupiers) tends to mean steadier, longer-held demand.
Who uses it? Investors weighing demand stability.
Use it alone? Read it with Hold Period and vacancy.
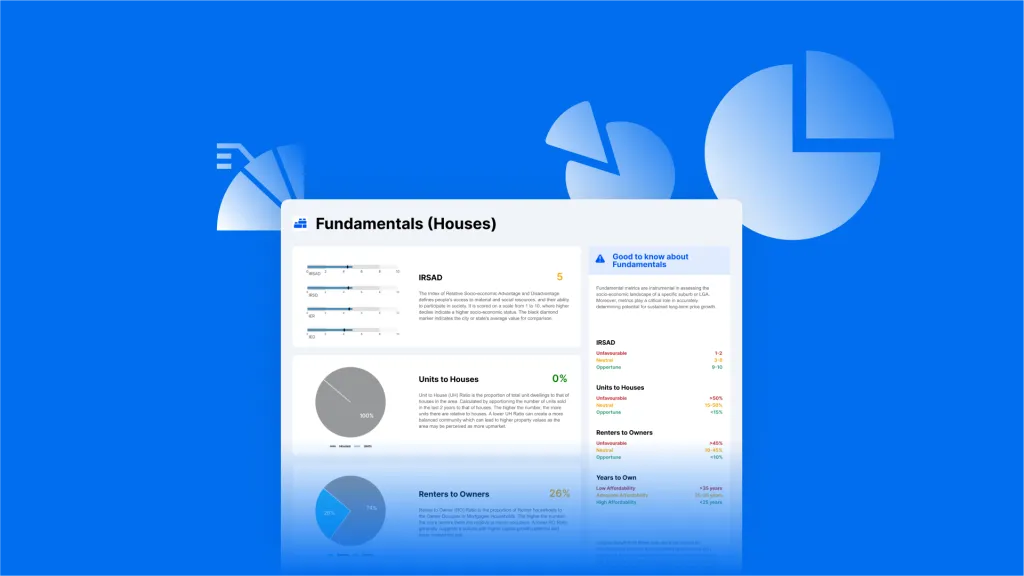
In this article we explore 3 fundamental real estate market metrics and explain why many investors chose to benchmark suburbs based on these indicators before moving on to assessment of market supply and demand.
If you are a property investor, you should be on the lookout for areas with a lower proportion of renters to owners (R|O ratio). These areas will typically have higher capital growth potential and will be less risky investments.
Furthermore, when looking for potential investment, it is beneficial to find areas with a lower proportion of units to houses (U|H ratio).
Lastly, you should consider investing in a suburb with higher IRSAD scores. The ABS (Australian Bureau of Statistics) has already done the hard work for you by gathering employment, education and other socio-economic data and produced a weighted comparative index for these parameters.
Renter to Owner (R|O ratio)
It is commonly accepted that a property market with a lower proportion of renters generally outperforms a market with a higher proportion of renters. That is why investors seek out areas where there is a lower proportion of renters as these areas offer greater potential for capital growth and rental yield.
So, why is it important to have a lower proportion of renters in a property market? There are a few reasons.
Renters are more likely to move than homeowners, which means that there is more turnover in the rental market with high proportion of renters leading to higher vacancy rates.
Furthermore, renters are more likely to default on their rental payments than homeowners are to default on their mortgage payments. This is because renters often have less financial security than homeowners, and they are also more likely to be impacted by economic downturns.
Finally, renters are less likely to take care of a property (and more likely to damage it) than homeowners are. This is because they do not have the same financial stake in the property, and they are also more likely to move if they are unhappy with the condition of the property.
Areas with a higher proportion of owner-occupiers typically indicate a more stable community. These neighborhoods may be more desirable, leading to potential increases in property values over time.
Markets with different R|O ratio: The Gap NT 4061 & West Haven NSW 2443
An oversupply of rental properties can lead to decreased demand and lower rental prices. This is bad news for landlords who are relying on rental income to help pay their mortgage, as well as those looking to sell their investment property.
Areas with a high ratio of owner-occupiers often see more consistent capital growth, as these homes aren’t frequently turned over. In addition suburbs with more homeowners can be less subject to market fluctuations, as they’re less likely to sell in a downturn, providing more stability in the real estate market.
It’s important to remember that an investment property is just that – an investment. And like any investment, you want to see it grow in value over time.
That’s why it’s important to have a healthy mix of owner-occupiers and renters in any given market. Too many renters and you could be sacrificing capital growth; too few and you may be missing out on steady rental income.
Units to Houses (U|H ratio)
It is a well-known fact that the more units there are in a real estate market, the lower is the likely ROI in the market. This is especially relevant to investors, as they are always looking for areas where there is potential for their investment to grow.
There are a few reasons why this is the case.
Firstly, when there are more units in an area, there is more competition for tenants among the investors. This means that landlords will have to lower their rents in order to attract and keep tenants, which in turn decreases the amount of rental income that they are bringing in.
Secondly, more units in an area also means that there is a higher likelihood of vacant properties. This is because it is more difficult to fill multiple units than it is to fill just a few houses. When there are a lot of vacant properties in an area, it brings down the overall value of the area, as well as the value of individual properties.
Lastly, having a lower proportion of units to houses in a suburb also makes the area more desirable to live in. This is because it creates a more balanced community, and people are generally more willing to pay more to live in an area that is seen as being more upmarket.
Property markets with an oversupply of units can be at risk of price drops if the market cools or if there are regulatory changes. Investing in a location with a lower proportion of units can mitigate this risk.
In addition, ownership of a house usually provides greater control over the property, allowing for renovations and improvements that can increase its value, whereas unit ownership can come with restrictions by strata or body corporate rules.
However, these are general principles and capital growth and rental yield prospects of a suburb would also depend on other factors. The investor’s personal goals and strategy should be considered too as some may prefer the typically lower entry cost and potentially higher rental yields of units in certain markets.
Want to know what an acceptable percentage of units to houses is? Visit the data dictionary and find the U|H metric.
Index of Relative Socio-economic Advantage and Disadvantage
Have you been gathering unemployment, education and other socio-economic data on suburbs in order to help you with property investment decision making? What if I told you that ABS has already done the hard work for you?
Meet IRSAD – Index of Relative Socio-economic Advantage and Disadvantage. It is a metric that encompasses multiple socio-economic indicators that many investors use to bench-mark high performant markets. See detailed analysis of this metric in this article.
A high index of relative advantage and disadvantage means that the suburb is a more attractive place to live, and that there will be more people moving into the suburb. This increased demand for property will drive up prices, and investors who purchase property in the suburb can see stronger capital growth in the long run.
0 – 2
2 – 4
4 – 6
6 – 8
8 – 10
0 – 2
2 – 4
4 – 6
6 – 8
8 – 10
Markets with different IRSAD score: Pimlico QLD 2481 & North Adelaide SA 5002
On the other hand, investing in areas with a low ISRAD score can be risky, but it can also be very profitable. These areas have the potential for high capital growth as the government and community services invest in these areas to improve the socioeconomic conditions. However, it is worthwhile confirming that the government does indeed have plans to allocate spending on improving the conditions in these suburbs.
As a property investor, you are always looking for areas with high potential for capital growth. If you are considering investing in an area with a high IRSAD index, it is important to do your research and consider supply / demand indicators in the area.
Summary
In conclusion, metrics like the renter to owner ratio, unit to house ratio, and IRSAD scores are invaluable tools for property investors when benchmarking suburbs for potential investments. These metrics provide a powerful, data-driven approach to understanding the numerous factors which influence property performance.
A lower ratio of renters to owners can suggest strong capital growth potential and lower risk, as these areas often have more stability and better property upkeep. A suburb with fewer units relative to houses can point towards higher demand and lesser competition, possibly leading to higher rental yields and future capital growth.
Meanwhile, a high IRSAD score reflects a suburb with significant socio-economic advantages, indicating a desirable place to live which can translate to increased demand and potential property value increase over time.
Nevertheless, remember these insights on ratios and indices serve as a starting point for your research. Each investor’s needs and strategies vary, so consider other supply and demand indicators along with specific property details, to ensure your investment aligns with your wider goals.
Where the fundamentals sit in the HtAG decision stack
IRSAD and the Renter to Owner Ratio are Level 1 foundations in the HtAG decision stack — the non-negotiable layer that gets checked before anything else. That ranking is not arbitrary. Socio-economic profile and tenure mix describe the buyer pool a suburb draws on, and the buyer pool is what ultimately sets what property there can be worth. Supply metrics tell you about this year; the fundamentals tell you about the decade.
The Unit to House ratio and Unit to House Value ratio sit a layer below as structural context. They tell you what kind of housing market you are actually in — whether the suburb’s price signal is dominated by detached housing, whether units are a meaningful part of the stock, and how the two price against each other. Getting that wrong is how investors end up comparing a house-dominated regional centre with an apartment-heavy inner suburb and concluding something about growth that is really just about built form.
How to use them: read the fundamentals first, as a gate. If a suburb fails on socio-economic profile or tenure mix for your strategy, the supply and cycle metrics will not rescue it, and there is no point spending time on them. Only once a suburb clears the foundation layer does it earn a proper look at Stock on Market, Inventory and the cycle indicators.
Connected metrics: IRSAD and Renter to Owner Ratio are read with Years to Own and Data Confidence to complete the foundation layer, and against Unit to House Ratio and Unit to House Value Ratio for built-form context. See their cards in the Fundamentals cluster.
Worked example: Ballarat Central, Victoria (June 2026)
Ballarat Central, VIC 3350 is a useful case because its fundamentals pull in directions that a single headline number would hide. Its IRSAD decile is 7 — the upper end of the band HtAG research identifies as the sweet spot, comfortably advantaged without the growth drag that shows up at the very top of the distribution.
Its Renter to Owner Ratio is 0.40, so the suburb is owner-occupier weighted but with a real tenant base — the mix that tends to produce stable occupancy without starving an investor of rental demand. The Unit to House ratio of 0.13 tells you this is decisively a house market: units exist but they are not what sets the tone. Their Unit to House Value ratio of 0.57 says the units that do trade go for a little over half the house price, which is a normal regional relationship rather than a distressed one.
The affordability reading completes the picture. Years to Own sits at 33.76 — materially lower than the metropolitan markets many investors compare it against, meaning local incomes carry local prices with more room than in a capital city. Against a Typical Price of $717,822, a median house rent of $449 a week and a 3.25% gross yield, Ballarat Central reads as a fundamentally sound, house-dominated regional market with genuine income support beneath it. Data Confidence is High, backed by 259 house sales over the year across an estimated 4,326 dwellings, inside the Ballarat City LGA.
Ballarat Central sits in IRSAD decile 7 with a 0.40 Renter to Owner Ratio, a 0.13 Unit to House ratio and Years to Own of 33.76 (June 2026). Advantaged but not extreme, owner-weighted but not tenant-free, and house-dominated — the fundamentals gate opens before the supply metrics are even consulted. (HtAG Analytics, June 2026)
Frequently asked questions
What is Renter to Owner Ratio?
The Renter to Owner Ratio is the proportion of renter households to owner-occupier and mortgagee households in a suburb.
Why does Renter to Owner Ratio matter to investors?
A lower renter share (more owner-occupiers) tends to mean steadier, longer-held demand.
What is a common mistake when reading Renter to Owner Ratio?
A common mistake is reading the ratio in isolation without hold period and vacancy to confirm demand stability.
Cite this metric
HtAG Analytics defines Renter to Owner Ratio as: “The Renter to Owner Ratio is the proportion of renter households to owner-occupier and mortgagee households in a suburb.”
Suggested citation: HtAG Analytics, “Renter to Owner Ratio,” HtAG Property Data Dictionary, July 2026.
Explore more: this metric is indexed in the HtAG Property Data Dictionary, and sits alongside every other concept, metric and method in the Education Hub — HtAG’s Property Intelligence Library.
This article forms part of the HtAG Property Intelligence Reference Library — a structured knowledge base documenting the concepts, metrics and methodologies used to analyse Australian residential property markets. Reference Standard PI-RORATIO · Version 1.0.
Tenure mix has a third dimension these two ratios do not capture: how much of the stock is held by a state or territory housing authority. That share moves owner-occupier demand independently of the renter-to-owner ratio, so it is worth reading alongside them — see how to check public housing concentration in a suburb.


love this. great refresher
Thank you for this article, very informative