
Bellambi, NSW 2518
Wollongong City Council, New South Wales
Good to Know
Bellambi, NSW 2518 is a high-value, tightly-held house market in the Wollongong City Council area, currently positioned as a long-hold capital growth submarket. The suburb is home to roughly 4,039 adults across approximately 2,053 dwellings, with a very low vacancy rate of 0.46%.
According to HtAG Analytics, Bellambi is exhibiting tight supply and strong rental demand. Stock on Market sits at 0.20% and Inventory at 1.69 months — well below the ~3-month balanced-market threshold — driving +9.6% YoY price growth and +10.5% YoY rent growth.
What the market data is signalling in Bellambi
Bellambi's faster rent growth (+10.5%) versus price growth (+9.6%) alongside a gross yield of 3.09% points to rising rental returns and strong tenant demand. Persistently low supply signals — 0.20% Stock on Market, 1.69 months Inventory and a quick 31 days on market — underpin upward pressure on both rents and prices. See the Markets in the Moment (MiM™) heatmap for a live view of these momentum patterns.
Who lives in Bellambi — and why it matters for investors
Bellambi records an IRSAD decile of 1, indicating relative socioeconomic disadvantage. That context often means more price volatility, differing demand drivers and tenant affordability pressures compared with higher‑IRSAD suburbs. The renter/owner split is 53% renters — an unfavourable mix for capital-protected owner-occupier demand but supportive of consistent rental demand. For more on how area advantage shifts long-run growth patterns, read the IRSAD Crossover study.
Why suburb-level data matters for Bellambi
Council-level averages can mask pockets like Bellambi. Investment decisions should rest on the suburb's own metrics: a typical house price of $1,324,399, a gross yield of 3.09%, Stock on Market at 0.20%, Inventory at 1.69 months and median days on market of 31 days tell a clear story about local tightness and turnover that council averages may dilute. Learn more in our LGA vs Suburb research.
Download the full Bellambi data guide for a printable deep-dive of these metrics.
What's behind the RCS™ score of 27
HtAG's RCS™ (Rating Composite Score) bundles three independent dimensions — risk minimisation, capital-growth potential and cashflow resilience — into one composite. An overall score of 27 flags trade-offs between strong near-term rental momentum and structural affordability/IRSAD pressures; reviewing the sub-score breakdown helps align Bellambi to a specific strategy (e.g. growth vs yield focus). See how the RCS™ is built. To analyse Bellambi interactively, open Bellambi in HtAG Copilot.
Forward signals to watch
vacancy rate — currently 0.46%: sustained sub‑1% vacancy typically signals tightening rental markets and continued upward pressure on rents over the next 12–24 months.
building approvals ratio — currently 0.71%: a neutral reading that suggests moderate new supply pipelines; watch for persistent increases that would relieve local tightness.
Sydney cycle phase: a city‑wide shift from expansion to slowdown would temper local momentum, while continued strength at the capital-city level would likely reinforce Bellambi's current rental and price gains.
Does this area meet your investment goals?
Get full accessCritical to know
RCS Breakdown
Bellambi's RCS™ headline is an overall signal — but it doesn't tell you why. The three sub-scores below reveal whether that score is earned through risk minimisation, capital growth, or cashflow — and which portfolio brief it fits.
starter
Investor
Pro
Critical to know
Market Trends
Bellambi's headline values — $1,367K to buy and $766PW to rent, a 2.91% gross yield. Over the past decade, prices have moved 101.04% and rents 72.52% — the Yield series shows whether that gap is widening (price outpacing rent, yield compressing) or closing.
$1,367K is today. The 10-year trajectory reveals whether that's the top of a run, the start of a new leg, or somewhere mid-cycle. Sign up to unlock the entire trend line.
$766PW today, with rent growth at (+7.43% YoY) compared to price growth (+12.49%). That spread determines yield is expanding or compressing across the next cycle. Sign up to unlock the entire trend line.
Where is Bellambi in its cycle - and is the 2.91% yield holding?
Cycle phase tells you whether you're buying near the bottom (room to run) or top (compression ahead). Yield trajectory tells you whether cashflow is durable or being eroded — the single most important question for a long-hold thesis.
Cycle Phase
Cycle Position
Yield Trajectory
Rent vs Price Spread
Investor
Pro
Area Risks
Property data alone won't flag the structural risks that can erode a long-hold position. Bushfire overlays, flood-zone exposure, and economic concentration sit outside the price feed but determine whether your capital is insurable, defensible, and structurally protected. Unlock to see.
Are there hidden structural risks shaping Bellambi's long-hold story?
Beyond the headline price, Bellambi carries risk signals a median can't show — hazard exposure from bushfire and flood overlays, and how narrowly local employment leans on a handful of sectors (the concentration the EDI score quantifies). Together these separate insurable, defensible long-holds from those carrying tail-risk that never surfaces in the headline number.
MADI Risk
EDI Risk
Bushfire
Flood
Investor
Pro
Critical to know
Supply & Demand
Bellambi's headline numbers show where the market is today. The two cards below answer where it's heading. Direction is what separates a buy from a wait.
Is housing supply tightening or building up?
Stock on Market is one number — the trend is what matters. SoM, inventory, building approvals and hold period together reveal whether the market is starving for stock (price pressure up) or quietly building a pipeline (pressure down).
Stock on Market
Inventory
Building Approvals
Hold Period
Is buyer and renter demand heating up or cooling off?
Vacancy is one signal — the real question is whether demand is still building or quietly peaking. Days on market, vacancy, search index and clearance rate are the four pulse-points — when they diverge, they signal a turning point.
Days on Market
Vacancy Rate
Search Index
Clearance Rate
Investor
Pro
Critical to know
Fundamentals
Bellambi can look solid on the surface — but the three layers below separate markets that genuinely hold value from ones that only look like they do.
Is Bellambi genuinely stable - or just expensive?
IRSAD hints at affluence, but socio-economic strength alone doesn't guarantee resilience. Combined with the renter-to-owner balance and unit-to-house ratio, you get the three signals that separate a tightly-held submarket from one carrying hidden volatility.
IRSAD
Renter to Owner
Units to Houses
Where do Bellambi prices go over the next 12 months?
Today's headline price is just a snapshot. Projected ROI and the volatility index tell you whether to commit capital now, wait for a softer entry, or rotate into a steadie submarket.
Projected Annual ROI
Volatility Index
Can you actually buy into Bellambi - and exit cleanly?
Tightly-held areas reward long-hold investors but punish anyone who needs liquidity. Annual sales and rental volume reveal whether your capital can reposition — or sits structurally locked in.
Annual Sales Volume
Annual Rental Volume
Investor
Pro
Important to know
Education & Infrastructure
Bellambi looks tightly-held and stable on the surface — but the three layers below separate areas that genuinely hold value from ones that only look like they do.
Does Bellambi's school catchment + infrastructure pipeline justify the price?
School ranks anchor family demand and tenant quality. The active infrastructure pipeline shifts a suburb's price ceiling over the next 5–10 years. Together they tell you whether Bellambi has structural support for the next leg of capital growth.
School Rank
Hospitals & Employment
Infrastructure Spend
Transport Projects
Investor
Pro
Full HtAG Intelligence
Bellambi shows potential. The platform tells you whether it's the best fit for your portfolio.
Price and yield are only the surface. HtAG reads the forces underneath — supply tightening or loosening, demand heating or cooling, and the risks that move slowly but decide long-term growth. Together they show whether Bellambi has the structural support for its next leg — or whether the numbers are running ahead of the fundamentals.
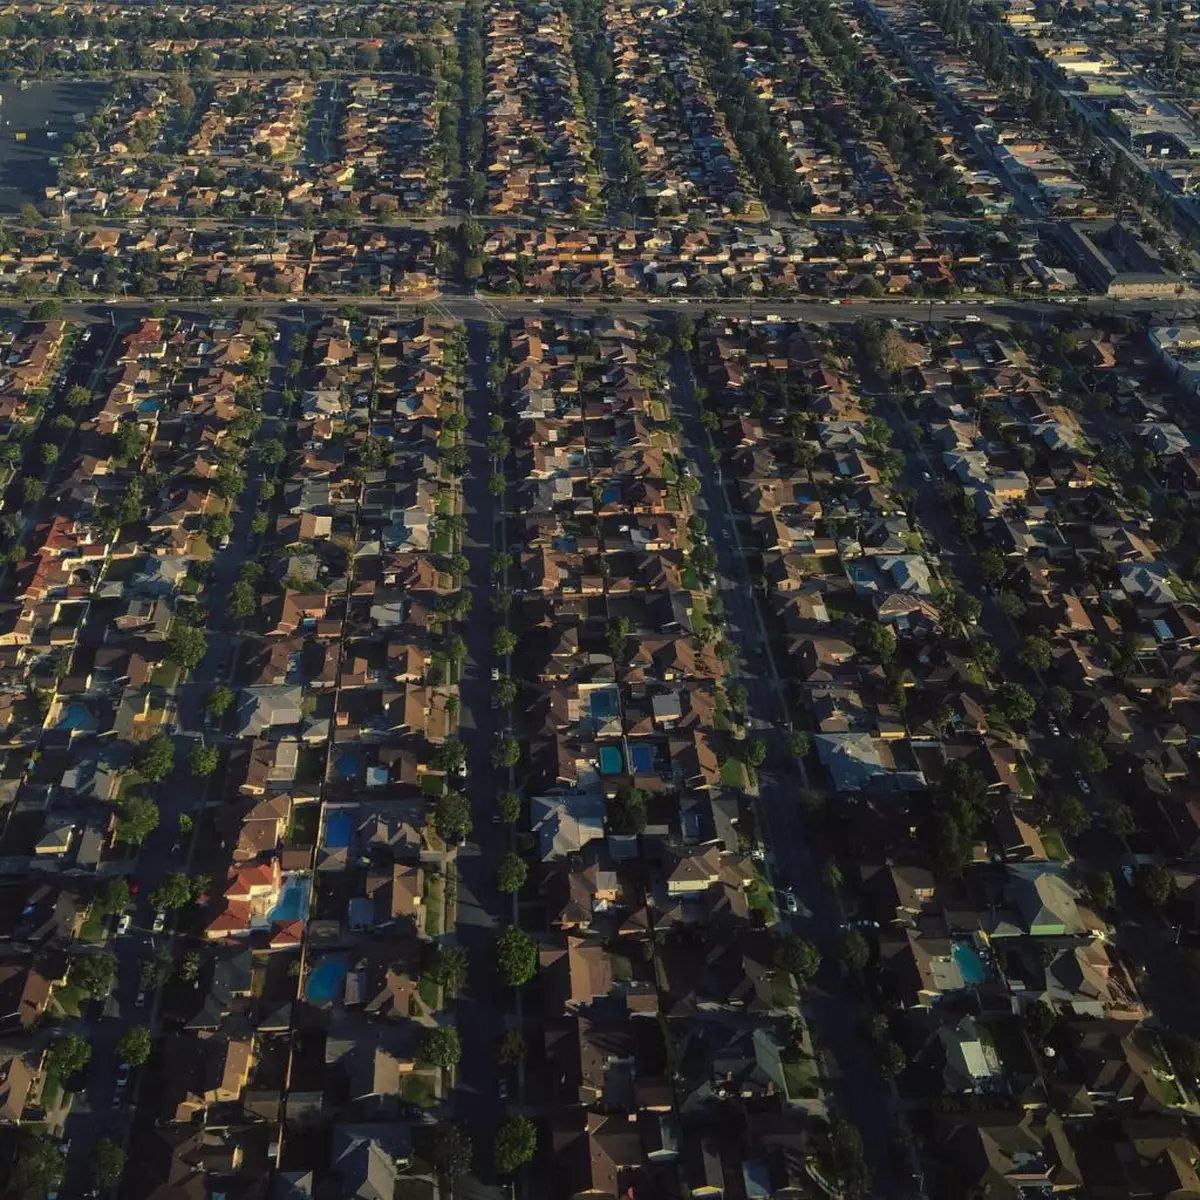
The total adult population (15 years or older) of Bellambi 2518 NSW is 3,303, with a median age of 38. Of those, 32.18% are married, 16.98% are divorced or separated, 44.99% are single and 5.78% are widowed.
The average household size is 2.3 people per dwelling, and the median household monthly income is estimated to be $6,188. The median monthly mortgage repayment for households in this suburb is $1,950 which is 31.51% of their earnings.
Source: ABS Census Data (2021)