


Short Summary
Australian housing markets in 2025 delivered another year of positive growth, but the national picture masks a sharp state-level divide. HtAG Analytics data across 3,600 suburbs shows WA led at 14.2% annual growth, while Victoria lagged at 4.7%. Critically, Victoria is the only state where yields are expanding (+10.3% over three years) and the Growth Rate Cycle (GRC) shows early-recovery momentum — making it 2026’s standout contrarian opportunity.
The National Picture: 2025 in Numbers
The Australian property market review for 2025 tells two stories. At the national level, house prices rose for a third consecutive year, with growth across every state and territory. But beneath the headline, a significant divergence has opened between western/northern markets and south-eastern markets — a split that defines the opportunity set heading into 2026.
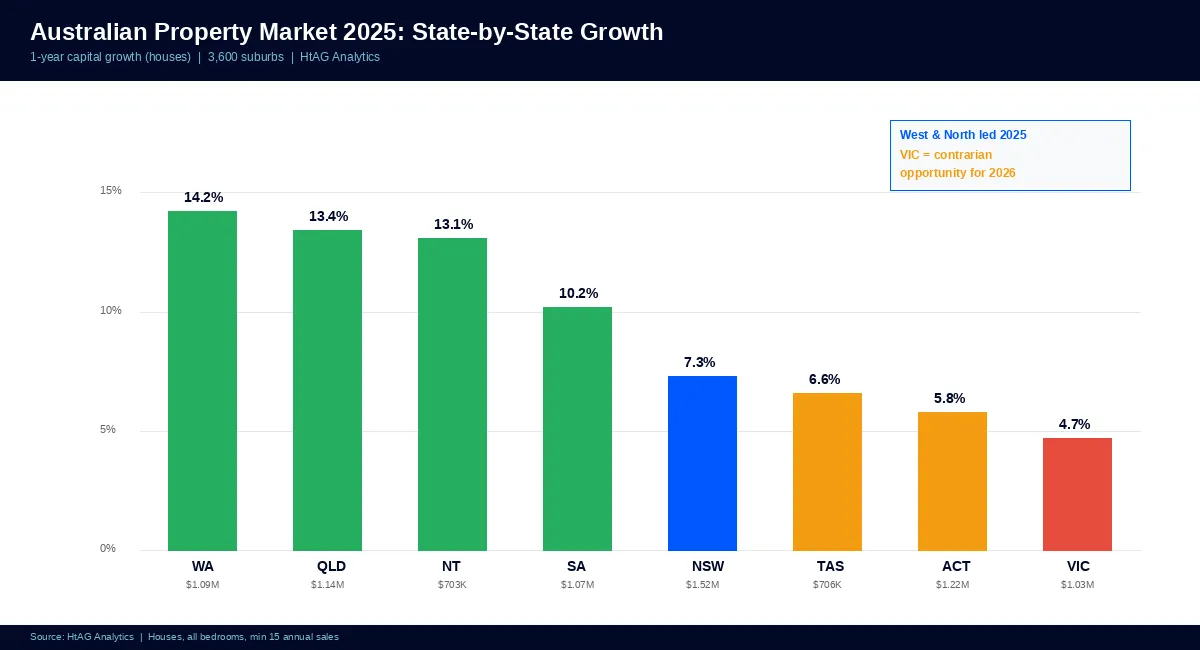
According to HtAG Analytics data across 3,600 suburbs nationally, the average one-year capital growth for houses was 9.4% at the national level. But state-level averages ranged from 14.2% (WA) to 4.7% (VIC) — a spread of nearly 10 percentage points. For context, a $750,000 property growing at 14.2% added $106,500 in equity over the year, while the same property growing at 4.7% added just $35,250. Suburb selection within these states amplifies the difference further.
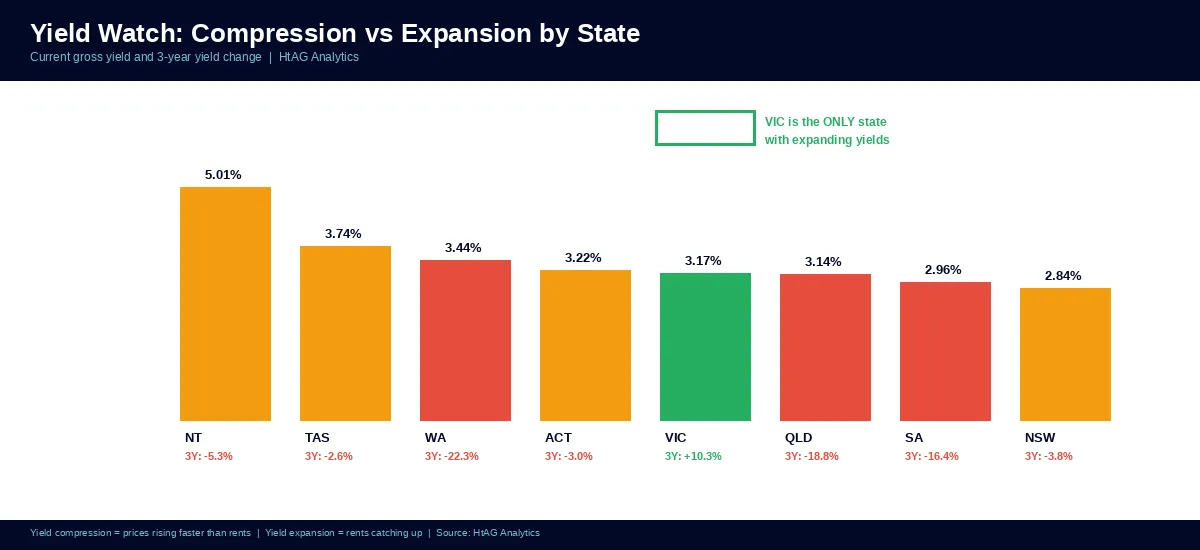
The national average yield compressed to 3.09%, reflecting the continued pattern of prices outrunning rents in most markets. However, Victoria stands alone as the only state where yields expanded over the past three years — a signal that rents are catching up to prices, creating improving cashflow dynamics for patient investors.
According to HtAG Analytics, WA delivered 14.2% annual house price growth in 2025 while VIC managed 4.7% — but Victoria is the only state where yields are expanding, signalling a contrarian opportunity for 2026.
State-by-State Performance Breakdown
| State | Suburbs | Avg Price | 1Y Growth | 5Y Growth | Yield | Vacancy | Avg DOM |
|---|---|---|---|---|---|---|---|
| WA | 405 | $1,092,455 | 14.2% | 98.7% | 3.44% | 1.25% | 43 |
| QLD | 766 | $1,139,336 | 13.4% | 91.5% | 3.14% | 1.41% | 47 |
| NT | 52 | $702,748 | 13.1% | 30.6% | 5.01% | 1.21% | 61 |
| SA | 418 | $1,074,062 | 10.2% | 85.7% | 2.96% | 1.15% | 38 |
| NSW | 1,135 | $1,518,290 | 7.3% | 43.0% | 2.84% | 1.52% | 48 |
| TAS | 114 | $706,236 | 6.6% | 38.5% | 3.74% | 1.04% | 47 |
| ACT | 88 | $1,218,294 | 5.8% | 25.6% | 3.22% | 1.31% | 37 |
| VIC | 622 | $1,033,543 | 4.7% | 24.1% | 3.17% | 1.45% | 48 |
Source: HtAG Analytics. Houses, all bedrooms, minimum 15 annual sales per suburb. Latest quarter.
Western Australia: The Momentum Leader
WA delivered the strongest annual growth at 14.2%, building on five years of 98.7% cumulative gains. Yields remain solid at 3.44% with tight vacancies (1.25%). However, Growth Rate Cycle (GRC) data shows 100% of WA suburbs are now in a (+) Decreasing phase — meaning prices are still rising but the rate of increase is slowing. WA is past peak momentum.
Queensland: Strong but Decelerating
QLD grew 13.4% over the year with 91.5% cumulative five-year growth. Like WA, 98% of Queensland suburbs are in (+) Decreasing GRC phase. The state’s five-year run has been exceptional, but the data suggests the easy gains are behind it. Suburb-level selection becomes critical — the variation within LGAs is wide, with Ipswich alone showing a 271-percentage-point spread between its best and worst suburbs.
South Australia: The Quiet Outperformer
SA continues to deliver strong growth (10.2% annual, 85.7% five-year) with the tightest vacancy rates in the country (1.15%) and the lowest average days on market (38). However, yields have compressed 16.4% over three years — investors are paying more for each dollar of rent. The IRSAD Crossover Effect is particularly powerful in SA, where low-IRSAD suburbs in the northern Adelaide corridor delivered some of the strongest growth nationally.
Victoria: The Contrarian Play
Victoria’s 4.7% annual growth is the weakest nationally, and its 24.1% five-year cumulative growth trails every other state. But the data tells a more nuanced story. Victoria is the only state where yields are expanding (+10.3% over three years), 29% of suburbs are in (+) Increasing GRC phase (early recovery), and average typical prices sit well below the five-year average — classic mean-reversion conditions.
Where Are We in the Cycle? GRC Phase Analysis
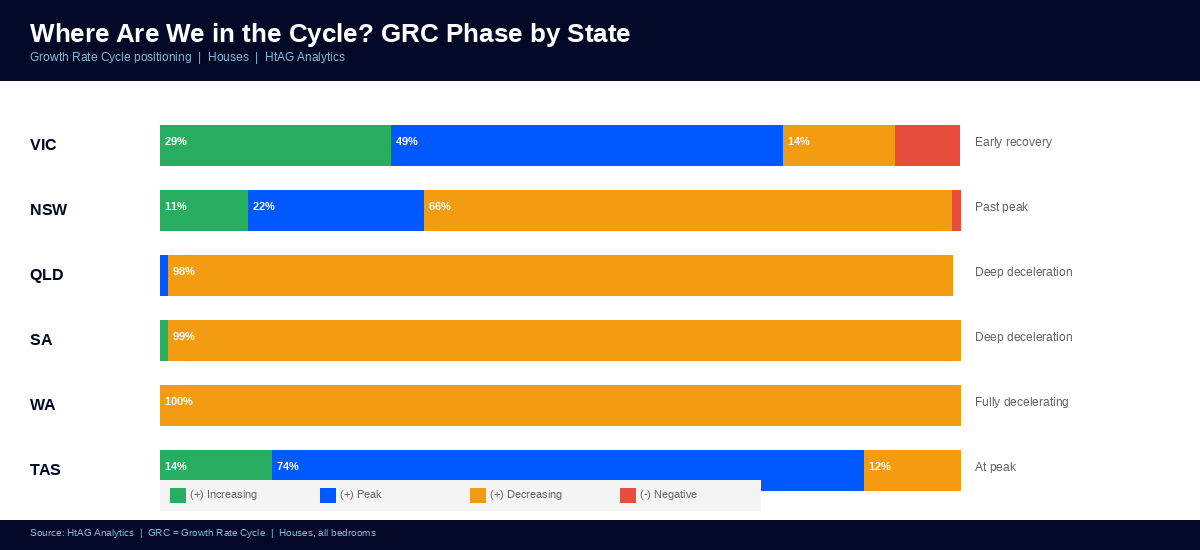
The Growth Rate Cycle (GRC) is HtAG’s proprietary market cycle indicator, tracking the year-on-year change in typical price and categorising each suburb into one of five phases: (+) Increasing (early recovery), (+) Peak, (+) Decreasing (decelerating growth), (-) Increasing (improving from negative), and (-) Trough (bottoming out).
| State | (+) Increasing | (+) Peak | (+) Decreasing | (-) Negative | Cycle Position |
|---|---|---|---|---|---|
| VIC | 29% | 49% | 14% | 9% | Early recovery |
| TAS | 14% | 74% | 12% | 0% | At peak |
| NSW | 11% | 22% | 66% | 1% | Past peak |
| QLD | 0% | 1% | 98% | 0% | Deep deceleration |
| SA | 1% | 0% | 99% | 0% | Deep deceleration |
| WA | 0% | 0% | 100% | 0% | Fully decelerating |
Source: HtAG Analytics. Houses, all bedrooms. GRC phase distribution by state, latest quarter.
The GRC landscape reveals a clear national pattern: the states that grew fastest over five years (WA, QLD, SA) are now deep in the deceleration phase, while the laggard (VIC) is showing early-recovery signals. This is textbook market cycle behaviour — and it is the foundation of HtAG’s 2026 market forecast, which identifies Victoria as the strongest mean-reversion candidate nationally.
According to HtAG Analytics GRC data, 29% of Victorian suburbs are in (+) Increasing phase — the highest proportion of any state — while WA, QLD, and SA have 99–100% of suburbs in deceleration. Victoria is where the next cycle is forming.
Yield Watch: Compression vs Expansion
| State | Current Yield | 3Y Yield Change | Rent Growth (1Y) | Signal |
|---|---|---|---|---|
| NT | 5.01% | −5.3% | 0.0% | Compressing (prices catching rents) |
| TAS | 3.74% | −2.6% | +0.1% | Mild compression |
| WA | 3.44% | −22.3% | +0.1% | Heavy compression |
| ACT | 3.22% | −3.0% | +0.1% | Mild compression |
| VIC | 3.17% | +10.3% | +0.1% | EXPANDING — rents catching prices |
| QLD | 3.14% | −18.8% | +0.1% | Heavy compression |
| SA | 2.96% | −16.4% | +0.1% | Heavy compression |
| NSW | 2.84% | −3.8% | +0.1% | Mild compression |
Source: HtAG Analytics. Houses, all bedrooms. 3-year yield change = percentage change in gross yield over 3 years.
Yield compression — where prices rise faster than rents — is the dominant pattern nationally. WA (−22.3%), QLD (−18.8%), and SA (−16.4%) have experienced aggressive compression as prices surged ahead of rental income. For investors focused on cashflow, this is a warning signal: entry yields are thin, and further price growth is required to justify current pricing.
Victoria’s yield expansion (+10.3%) runs against this national trend. Rents in Victoria are rising while prices have been flat, improving the cashflow equation for new entrants. Combined with the GRC showing early-recovery momentum, this creates the unusual dual signal of improving yield and improving growth trajectory — a combination that rarely persists for long.
As HtAG’s research into undervalued suburbs demonstrates, the intersection of expanding yields and early-cycle GRC positioning is the strongest forward-looking indicator of sustained growth.
The Victorian Contrarian Case for 2026
The data assembles a compelling contrarian thesis for Victoria in 2026. Three signals converge:
- GRC early recovery: 29% of Victorian suburbs are in (+) Increasing phase — the highest proportion nationally. This is where the next growth cycle is forming.
- Yield expansion: Victoria is the only state where yields are expanding (+10.3% over three years). Improving cashflow attracts both investors and owner-occupiers.
- Mean reversion: Victoria’s 24.1% five-year growth is well below its 10–15 year average. Historical patterns consistently show underperforming states reverting toward long-run averages within 2–3 years.
The risk is timing — 9% of Victorian suburbs are still in negative territory, and the recovery is unevenly distributed. Suburb-level selection is critical. HtAG’s GeoDex heatmap allows investors to identify exactly which Victorian suburbs have entered the recovery phase, filtered by IRSAD crossover zone, public housing screening, and RCS quality scores.
HtAG Analytics data shows Victoria is the only Australian state with all three contrarian signals: early-cycle GRC recovery (29% of suburbs), yield expansion (+10.3%), and deep mean-reversion potential (24.1% five-year growth vs national average of 54%).
What the Data Says About 2026
Based on HtAG Analytics’ state-level and suburb-level indicators, here is how the 2026 landscape is shaping:
- WA and QLD: Growth will moderate. Both states are 100% in GRC deceleration. Prices may still rise, but at a slowing pace. Yield compression limits cashflow. Selective suburb picking becomes essential — the best opportunities are now in adjacent corridors and regional spillover zones.
- SA: Similar to QLD/WA but with slightly more runway. SA’s lower typical prices and tight vacancies (1.15%) provide some buffer. Northern Adelaide corridors remain active.
- VIC: The contrarian play. Early-cycle GRC positioning, yield expansion, and mean-reversion potential make Victoria the strongest risk-adjusted opportunity for 5–10 year investors. Target IRSAD 2–5 crossover suburbs with low public housing and improving demand indicators.
- NSW: Mixed. Sydney’s premium suburbs face affordability ceilings, but 11% of suburbs are in (+) Increasing phase — pockets of early recovery exist. Regional NSW offers better value.
- TAS: At peak. 74% of suburbs in (+) Peak phase. Growth may be peaking; timing of exit or hold matters.
The HtAG Evidence Portal provides detailed suburb-level case studies showing how GRC, yield, and IRSAD signals have translated into real purchasing outcomes across 135 validated recommendations.
Key Takeaways
- WA led 2025 at 14.2% annual growth, followed by QLD (13.4%) and NT (13.1%). VIC trailed at 4.7%.
- The national cycle is split: WA, QLD, and SA are deep in GRC deceleration (99–100% of suburbs), while VIC has 29% of suburbs in early recovery.
- Victoria is the only state with expanding yields (+10.3% over three years) — rents are catching prices, improving cashflow for new entrants.
- Yield compression in WA (−22.3%) and QLD (−18.8%) means investors in those markets are paying more for each dollar of rent than at any point in the past three years.
- Victoria’s contrarian case combines three signals: early-cycle GRC, yield expansion, and deep mean-reversion potential — a rare convergence.
- Suburb-level selection is now more important than state selection. HtAG Analytics tracks 106 metrics across 3,600 suburbs to identify which pockets within any state offer the best risk-adjusted entry points.
From Data Signal to Portfolio Decision
The GRC, yield trend, IRSAD, and RCS metrics described in this article are live inside the HtAG Analytics platform — updated each quarter as new valuation data flows in. Professional buyers agents use these signals to time entries, identify contrarian opportunities, and build conviction before making offers.
If you’re building a portfolio and want to see the exact data powering articles like this one, the HtAG Starter Plan gives you access to suburb-level analytics across every Australian market — no lock-in, cancel any time.
Start your HtAG Analytics membership →
Frequently Asked Questions
Which Australian state had the highest property growth in 2025?
Western Australia led with 14.2% annual house price growth in 2025, according to HtAG Analytics data across 3,600 suburbs. Queensland followed at 13.4%, and South Australia at 10.2%. Victoria was the slowest at 4.7%.
Is Victoria a good place to invest in property in 2026?
HtAG Analytics data shows Victoria has the strongest contrarian signals for 2026: 29% of suburbs in early GRC recovery, the only state with expanding yields (+10.3%), and five-year growth well below the long-run average (mean-reversion potential). However, suburb-level selection is critical — 9% of Victorian suburbs are still in negative territory.
What is yield compression and why does it matter?
Yield compression occurs when property prices rise faster than rents, reducing the rental return as a percentage of price. HtAG Analytics data shows WA yields compressed 22.3% over three years and QLD compressed 18.8%. For investors focused on cashflow, compressed yields mean higher holding costs relative to rental income.
What is the Growth Rate Cycle (GRC)?
The Growth Rate Cycle (GRC) is HtAG Analytics’ proprietary market cycle indicator. It tracks the year-on-year change in typical price for each suburb and assigns it to a phase: (+) Increasing (early recovery), (+) Peak, (+) Decreasing (decelerating), (-) Increasing (improving from negative), or (-) Trough. The GRC helps investors time entries and avoid buying at the peak of a cycle.
How many suburbs does HtAG Analytics cover in Australia?
HtAG Analytics tracks 3,600+ suburbs nationally with 106 data points per suburb, updated quarterly. Coverage spans all eight states and territories, including both metro and regional markets. The GeoDex heatmap provides visual access to all tracked suburbs, and the Starter Plan gives investors direct access to the full dataset.
Disclaimer: This article is for educational purposes only and does not constitute financial advice. Property investment carries risks, and past performance is not indicative of future results. All growth rates, yields, and projections are derived from historical data and statistical modelling — they are not guarantees of future performance. Always conduct your own due diligence and consult a qualified financial adviser before making investment decisions.


