


Short summary. Across 4,041 Australian house markets with continuous monthly price history from January 2007 to May 2026, HtAG identified 1,691 occasions where a suburb’s typical house price fell 10% or more from its own previous peak. Of the 1,457 that have since recovered, the median took 84 months — seven years — to get back to the old peak. Recovery time varied far more by state and timing than by how far prices fell.
In 30 seconds
What is it? A measurement of how long Australian suburb house prices have historically taken to climb back to a previous peak after falling at least 10%.
Why does it matter? “Property always recovers” is true on a long enough horizon. The useful question is how long the wait has actually been — because that wait is the holding cost, the refinance risk and the opportunity cost.
Who uses it? Investors sizing downside, buyers agents setting client expectations, and anyone deciding whether to buy into a market that has already fallen.
Use it on its own? No. This is historical context about the range of outcomes, not a forecast of any particular market’s next move.
On this page
- What we measured
- Most markets never fell 10% at all
- When they did fall, the median wait was seven years
- Depth does not tell you duration
- The state gap is the biggest single divider
- When you bought mattered more than what you bought
- The markets still waiting
- What this changes about how you read a falling market
- Limitations and what this study cannot tell you
- Frequently asked questions
Every time an Australian housing market turns down, the same question follows within days: how long until it comes back?
The answers on offer are usually national commentary and forecasts. Almost none of them measure what actually happened, market by market, the last time prices fell — which is odd, because Australia has nineteen years of monthly suburb-level price history sitting right there.
So we measured it. Not for the country, and not for the capital-city aggregate — for 4,041 individual house markets, one at a time.
What we measured
We used HtAG’s monthly Typical Price series — a robust central price that is less exposed to the composition swings that distort a simple median — for every Australian suburb house market from January 2007 to May 2026.
A market entered the sample if it had continuous coverage across that whole window and a median of at least two house sales a month, which removes the very thinnest markets where a monthly price reading carries little information. That left 4,041 house markets.
For each one we tracked a running peak. Any month the price sat below that peak, the market was “underwater”. A spell counted as a drawdown episode if the price fell at least 10% below the peak at some point before recovering. Recovery was the first month the price reached the old peak again. That gave 1,691 episodes across 1,520 markets — 1,457 recovered, 234 still underwater at May 2026.
In plain English: imagine writing down the highest price a suburb has ever reached, then waiting for the day it beats that number again. This study is a stopwatch on that wait, run 1,691 times.
Most markets never fell 10% at all
The first result is the one most likely to be misread, so it goes first. Of the 4,041 markets in the sample, 2,521 — 62.4% — never recorded a 10% peak-to-trough fall in the entire 19 years, a stretch that includes the global financial crisis, the end of the mining boom, the 2017–19 credit squeeze, a pandemic and the fastest rate-hiking cycle in a generation.
A double-digit fall is the minority experience. But it is not a rare one either: 1,520 markets — better than one in three — had at least one, and some had two.
When they did fall, the median wait was seven years
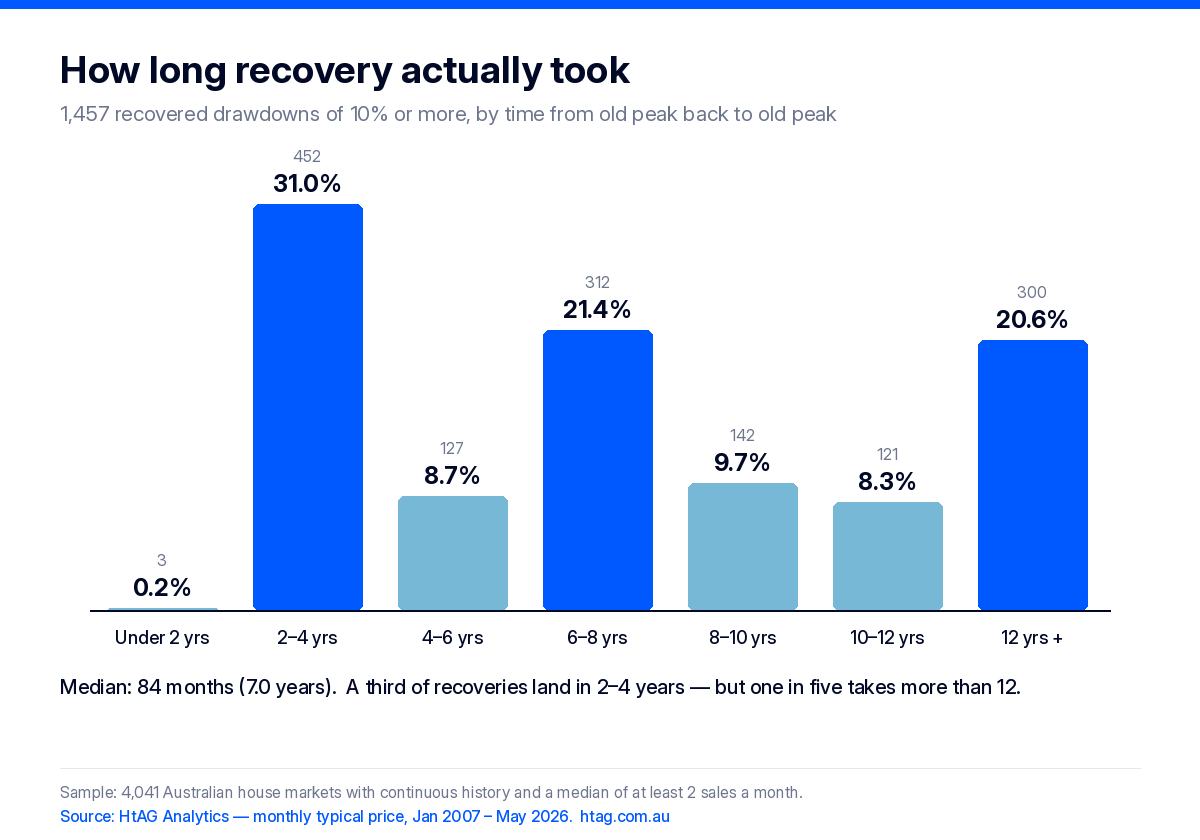
Among the 1,457 episodes that have recovered, the median time from old peak back to old peak was 84 months — exactly seven years. A quarter took under 42 months. A quarter took more than 131 months. One in ten took more than 166 months, and the longest completed round trip in the sample ran 220 months, or 18.3 years.
The shape matters more than the median, though. Recoveries are not clustered around seven years — they are bimodal. Nearly a third landed in the two-to-four-year band, and then a second peak appears out past twelve years.
Three episodes in 1,457 — 0.2% — recovered in under two years. If a market has fallen 10% or more, a fast bounce is close to unheard of.
The decline itself is slower than most people expect. The median episode kept sliding for 43 months — three and a half years — before it found a floor. Falling property markets do not crash and snap back; they grind.
Median depth was −15.9%. A quarter of episodes fell more than 22.9%, and the deepest decile fell more than 36.2%.
Depth does not tell you duration
The intuitive model is that a deeper hole takes longer to climb out of. The data does not support it, and the cleanest way to see that is to hold depth roughly constant and look at what happened next.
These six established, higher-turnover markets all fell between 15.6% and 20.4% — practically the same fall. Their recovery times differ by a factor of nearly five.
| Market | Peaked | Fall | Months to recover | Back to peak |
|---|---|---|---|---|
| Castle Hill, NSW 2154 | Nov 2017 | −15.6% | 35 | Oct 2020 |
| Quakers Hill, NSW 2763 | Jan 2009 | −20.2% | 55 | Sep 2013 |
| Werribee, VIC 3030 | Nov 2011 | −17.9% | 69 | Aug 2017 |
| Craigmore, SA 5114 | Jul 2012 | −16.0% | 99 | Nov 2020 |
| Redbank Plains, QLD 4301 | Jan 2007 | −18.3% | 141 | Oct 2018 |
| Ellenbrook, WA 6069 | Dec 2007 | −20.4% | 168 | Dec 2021 |
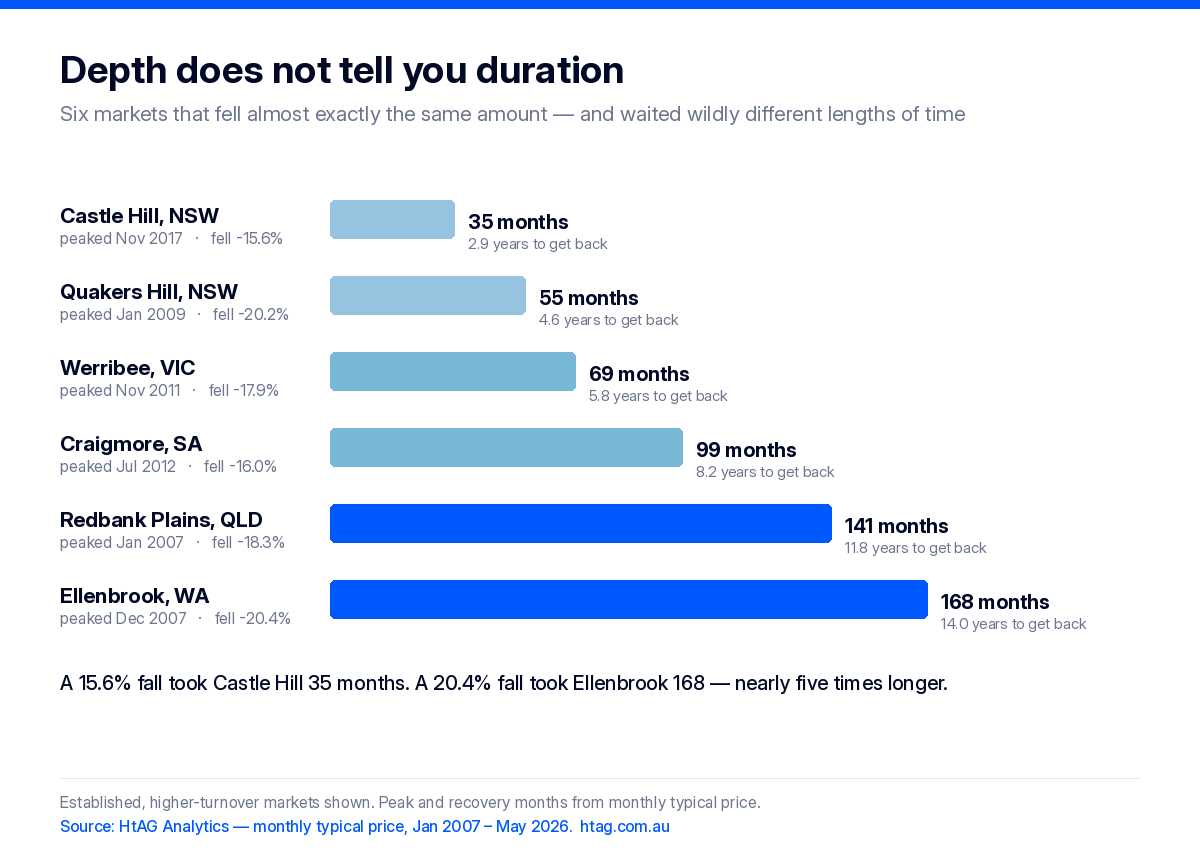
In plain English: how far you fall tells you how bruised you are. It tells you almost nothing about how long you will be on the floor. That depends on what is going on around you.
The state gap is the biggest single divider
If depth does not explain the spread, something else has to. The strongest divider in the data is geography.
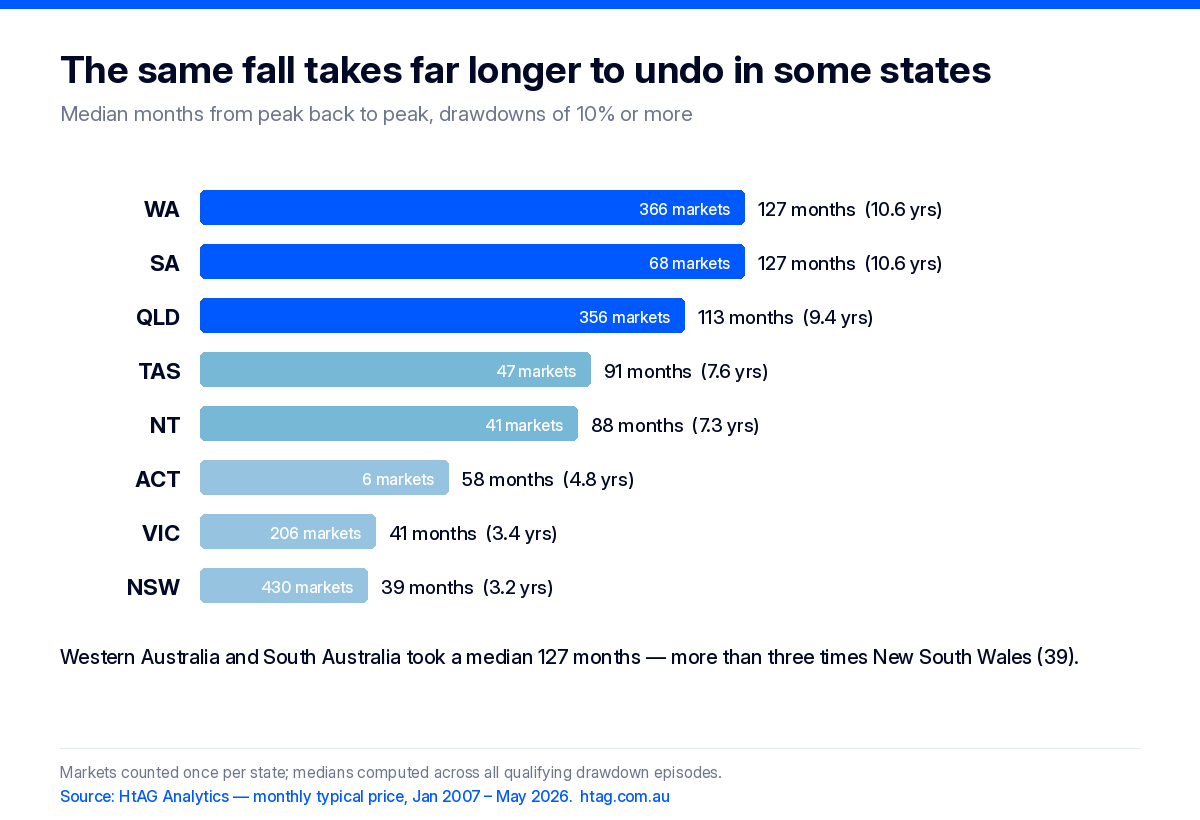
Western Australian and South Australian markets took a median 127 months to recover — more than ten and a half years, and over three times the New South Wales median of 39 months. Queensland sat at 113 months, Tasmania 91, the Northern Territory 88, the ACT 58 and Victoria 41.
Depth moved in the same direction but nowhere near as far: WA’s median fall was 21.0% against NSW’s 13.9%. A 51% difference in depth accompanied a 226% difference in duration. The falls were somewhat worse in the west; the waits were in a different category altogether.
WA and QLD also carry the most affected markets — 366 and 356 respectively — which is what you would expect from economies that rode a resources cycle up and then down. It is the same structural story that shows up in HtAG’s work on what happens after a property boom: the markets that run hardest on a single driver are the ones that spend longest waiting afterwards.
When you bought mattered more than what you bought
Splitting episodes by the year the peak occurred produces the sharpest gradient in the study.
| Peak occurred | Episodes | Median months to recover | Median fall | Still underwater |
|---|---|---|---|---|
| 2007–2009 | 504 | 133 | −19.1% | 15 |
| 2010–2014 | 544 | 93 | −18.4% | 32 |
| 2015–2019 | 415 | 38 | −13.8% | 15 |
| 2020–2026 | 228 | 42* | −13.6% | 172 |
A market that peaked in 2007–2009 waited a median 133 months — over eleven years. One that peaked in 2015–2019 waited 38 months. Same country, similar-sized falls, a wait three and a half times longer depending on which year you happened to buy.
That asterisk on the bottom row is the most important thing on this page, and it is worth being blunt about it. Because we can only measure recovery once it has happened, any recent cohort is dominated by the markets that bounced fastest. The slow ones are still out there, uncounted, dragging the real number upward. Anyone quoting “recent downturns recover in three and a half years” from a table like this is reading survivorship, not history. Understanding where a market sits in its own property market cycle — and whether it has actually turned, which is what GRC Minima is built to detect — matters more than the cohort average.
The markets still waiting
At May 2026, 234 episodes had fallen 10% or more and had not yet regained the old peak. The median has been underwater 89 months and counting. The longest has been below its peak for 232 months — 19.3 years, essentially the entire study window.
These are not failed markets in any moral sense. Many are perfectly functional suburbs where people live good lives. They are simply markets where a buyer at the peak has not, on a typical-price basis, seen a nominal gain in a very long time. That is the risk the seven-year median is averaging over, and it is why HtAG treats price stability as a measurable property in its own right through the Property Volatility Index and the National Property Risk Report.
What this changes about how you read a falling market
Three things follow from the numbers, and none of them is a rule about what to buy.
A fall is not a countdown. The instinct to treat a 15% drop as “15% of recovery to go, so maybe two years” is not what the record shows. The median episode spent 43 months still falling. Half of everything took seven years or more from the top.
The question “how far has it fallen?” is less useful than “what is this market’s engine?” The state gap and the era gap both point the same way: recovery speed tracked the breadth of the economy underneath the suburb far more closely than it tracked the size of the fall. Depth is a symptom. Structure is the cause.
“It always comes back” and “you can afford to wait” are different claims. The first is broadly supported — 1,457 of 1,691 episodes recovered. The second depends entirely on whether your holding period, serviceability and patience can absorb a median of seven years and a tail past fifteen. That is a personal-finance question, not a market question, and the honest answer differs for every buyer.
This is also why HtAG publishes tests of the signals investors actually rely on rather than forecasts alone. A number that tells you what a market is is worth more than a number that tells you what it might do.
Limitations and what this study cannot tell you
- It is not a forecast. Nineteen years of history describes a distribution of past outcomes. It does not predict how long any current or future downturn will last in any given suburb.
- Censoring biases the recent cohort. Episodes still underwater have no recovery date and are excluded from duration medians. The 2020–2026 row is the clearest case: 172 of 228 episodes are unresolved.
- Figures are nominal. No inflation adjustment is applied. In real, after-inflation terms every recovery here took longer than stated.
- Composition effects in fast-developing suburbs. In greenfield areas the mix of homes selling can change dramatically year to year, so an apparent price fall may partly reflect smaller homes selling rather than the same home losing value. Extreme readings concentrate there. Excluding the 75 episodes deeper than −50% — where such artefacts cluster — moves the median recovery only from 84 to 83 months, so the central finding does not rest on them.
- Sample scope. Houses only, all bedroom counts, suburb level. Markets needed continuous coverage and a median of at least two sales a month, so results describe reasonably transacted markets rather than very thin ones.
- Peak-to-peak is one definition of recovery. An investor who bought below the peak, or who valued the holding for its rent, would measure recovery differently.
HtAG Data — cite this
Study: House price drawdown and recovery duration in Australian suburb markets, 2007–2026.
Publisher: HtAG Analytics.
Sample: 4,041 Australian house markets; 1,691 drawdown episodes of 10% or more; 1,457 recovered, 234 unrecovered.
Data: HtAG monthly Typical Price series, January 2007 – May 2026. Suburb reference figures as at 31 July 2026.
Headline finding: median time from peak back to peak was 84 months (7.0 years); 62.4% of markets recorded no fall of 10% or more across the period.
Suggested citation: HtAG Analytics (2026), How Long Do House Prices Take to Recover? Evidence From 4,041 Australian Markets. Available at htag.com.au.
Surface this data inside your AI agent
The monthly price series behind this study is queryable directly from Claude, Perplexity, Manus and any other MCP-compatible client through HtAG’s Australian property data API and MCP platform — 104+ REST endpoints and 70+ public MCP tools covering 7,000+ suburbs and all 537 LGAs. You can ask an agent for a suburb’s price history and market position and get the same underlying numbers used here, rather than a summary of somebody’s blog post.
Developers can request access to the HtAG Developer Portal, or read the technical documentation.
Frequently asked questions
How long do house prices take to recover in Australia?
Across 1,457 recovered drawdowns in 4,041 Australian house markets between 2007 and 2026, the median time from a market’s previous peak back to that peak was 84 months, or seven years. The middle half of episodes took between 42 and 131 months, and one in ten took more than 166 months.
Do Australian house prices always recover?
Most do, eventually. Of 1,691 falls of 10% or more since 2007, 1,457 had returned to their old peak by May 2026 and 234 had not. Those 234 had been below peak for a median of 89 months at that point, and the longest for 232 months. “Recovers eventually” and “recovers within your holding period” are different propositions.
Does a bigger price fall take longer to recover?
Surprisingly little. Six markets in this study fell within a narrow band of 15.6% to 20.4% and took between 35 and 168 months to recover — a near fivefold spread on almost identical falls. State and the timing of the peak explained far more of the variation in duration than depth did.
Which Australian states took longest for house prices to recover?
Western Australia and South Australia, both at a median 127 months, followed by Queensland at 113. New South Wales was fastest at 39 months and Victoria close behind at 41. Western Australia and Queensland also contained the largest number of affected markets, at 366 and 356 respectively.
How long does the fall itself last before prices bottom out?
Longer than most people assume. The median episode kept declining for 43 months — about three and a half years — before reaching its trough. Only 3 of 1,457 recovered episodes, 0.2%, completed the full round trip in under two years.
Can this study tell me how long the 2026 downturn will last?
No. It describes the distribution of past outcomes across nineteen years and thousands of markets; it is not a forecast for any individual suburb or for any current cycle. Its practical use is calibrating expectations about the range of possible waits, and showing that the range is far wider than the national conversation usually allows.
Can I access this data inside Claude or Perplexity?
Yes. HtAG operates 6 MCP servers, 3 of them listed publicly on the Model Context Protocol registry under com.htagai, exposing 70+ MCP tools across 7,000+ Australian suburbs. Apply through the HtAG Developer Portal to query the same price history from your AI client.
Continue learning
- What Happens After a Property Boom? 3,886 Suburbs, 5 Years On — the mirror image of this study, measuring what follows the run-up rather than the fall.
- Which Australian Suburbs Are Entering Recovery Phase in 2026? — where markets sit in the cycle right now, rather than how long past recoveries took.
- What Is the Property Volatility Index? — why price stability is worth measuring before you buy.
- Are Property Booms Contagious? A 6,229-Market Test — how price moves spread between neighbouring markets.
- What Is Property Intelligence? — the framework these studies sit inside.
- HtAG Education Hub — the full Property Intelligence reference library.
The conceptual framework behind this metric is published openly for transparency and education. Its proprietary implementation — calibration, weighting, validation and the underlying data — remains the confidential intellectual property of HtAG Analytics.
This article forms part of the HtAG Property Intelligence Reference Library — a structured knowledge base documenting the concepts, metrics and methodologies used to analyse Australian residential property markets.
Reference Standard PI-RECOVERYTIME · Version 1.0
Disclaimer: this article is general information only and does not take account of your objectives, financial situation or needs. It is not financial, investment, tax or legal advice, and it is not a forecast. Past price behaviour is not a reliable indicator of future performance. Consider obtaining advice from a licensed professional before making a property decision.
