

Melbourne Property Market 2026: Prices, Rents & Outlook
A two-speed market: houses grinding higher while units barely move.
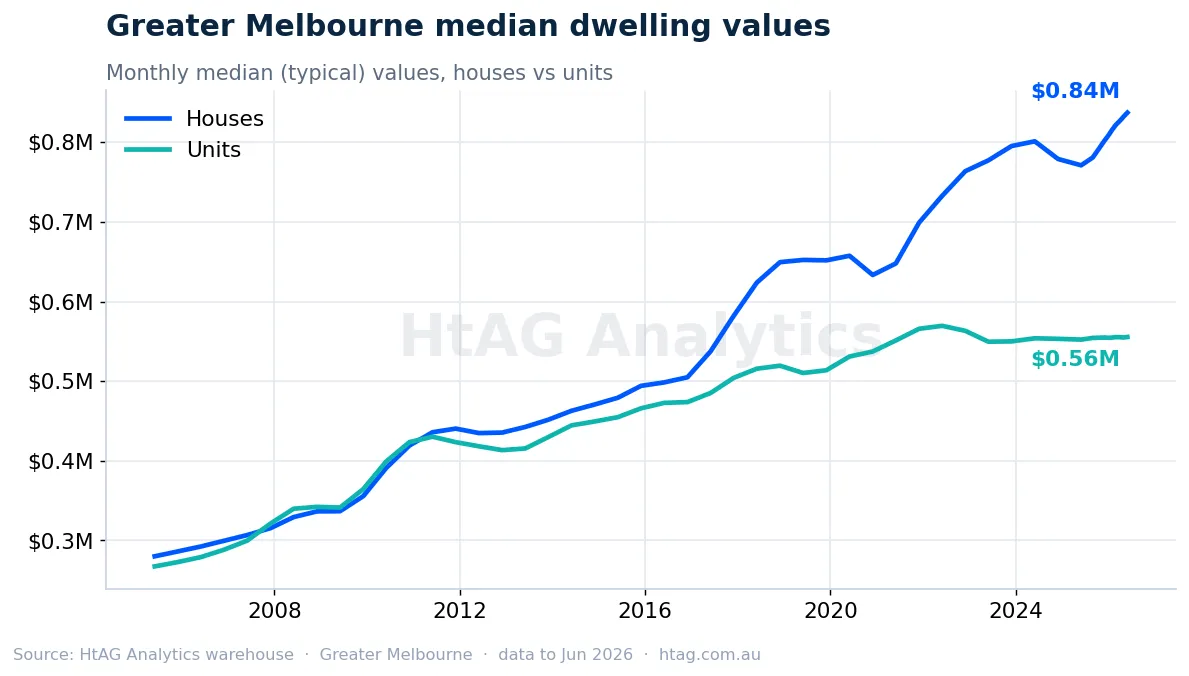
House values have reached $837K (+8.6% over the year) while units sit at $555K — up just +0.8% over five years. A tight rental market keeps vacancy around 1.7% and rents rising, even as the RBA cash rate holds near 4.35%.
The Melbourne property market at a glance
Here is the Melbourne market at a glance, before we work through the data. Houses and units have pulled apart — and a house now costs about 1.5× a unit. HtAG also breaks the same data down to Melbourne’s investment sub-markets.
| Metric — Greater Melbourne, Jun 2026 | Houses | Units |
|---|---|---|
| Median dwelling value | $837K | $555K |
| Growth — past 12 months | +8.6% | +0.6% |
| Growth — past 5 years | +29.2% | +0.8% |
| Growth — past 10 years | +67.9% | +17.5% |
| Median asking rent | $721/wk | $545/wk |
| Indicative gross yield | ~4.5% | ~5.1% |
Market-wide: rental vacancy 1.7%, auction clearance ~60% (3-mo avg) and the RBA cash rate at 4.35%. Source: HtAG Analytics warehouse, Greater Melbourne, Jun 2026.
What “Melbourne” covers: “Greater Melbourne” here is HtAG’s metropolitan definition — the 31 Melbourne metro local government areas, from Wyndham and Melton in the west to the Yarra Ranges, Casey and the Mornington Peninsula. It reflects the commonly understood Melbourne metro area and approximates, rather than exactly matches, the ABS “Greater Melbourne” statistical area.
All growth figures on this page are the change in the median (typical) dwelling value over the period — a median-based measure, not a hedonic index. Median-based growth can differ from hedonic indices (such as CoreLogic’s) because it also reflects shifts in the mix of what is selling, not price movement alone.
Where Melbourne prices sit today
The median Melbourne house is now worth about $837K and the median unit $555K. Over the past year, houses moved +8.6% and units +0.6%.
The gap is stark: a typical Melbourne house now costs about 1.5 times a unit. Houses, with their scarce land component, have captured the growth while a steady flow of new apartments has capped unit values.
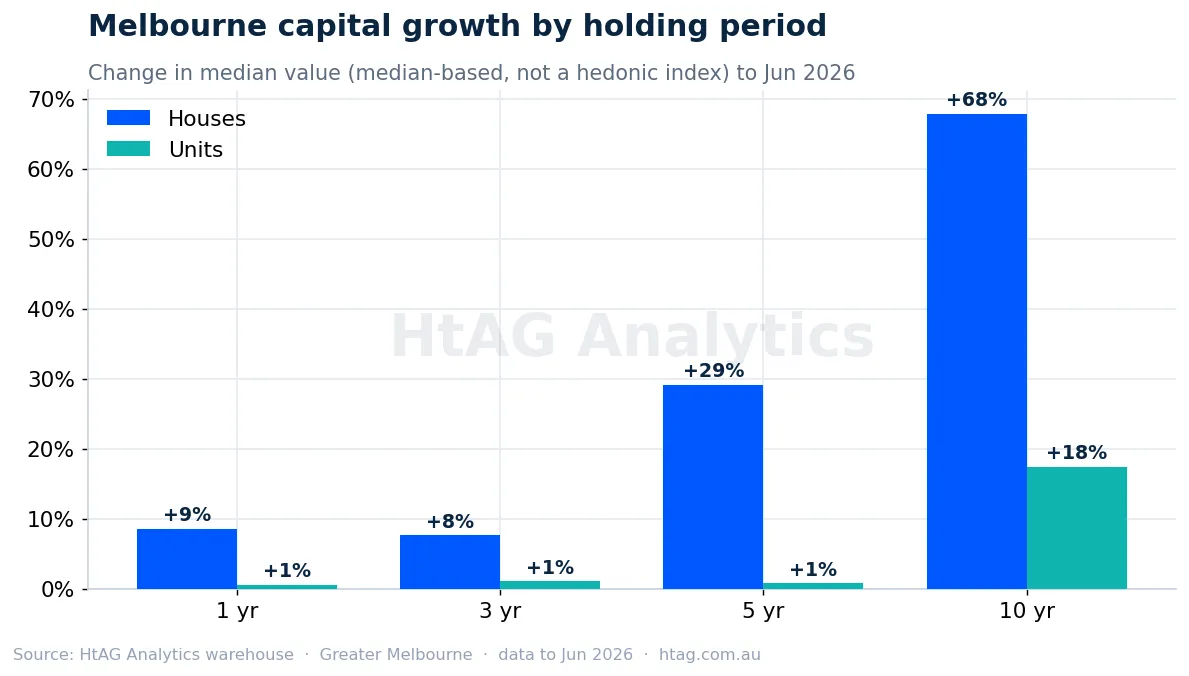
Growth by holding period
Over ten years, Melbourne house values are up +67.9% and units +17.5%. Over five years it is +29.2% versus +0.8%. These are median-based figures — the change in the typical dwelling value, not a hedonic index — so they can differ from indices such as CoreLogic’s.
That is a classic two-speed split: growth has concentrated almost entirely in houses, while units have barely moved in real terms.
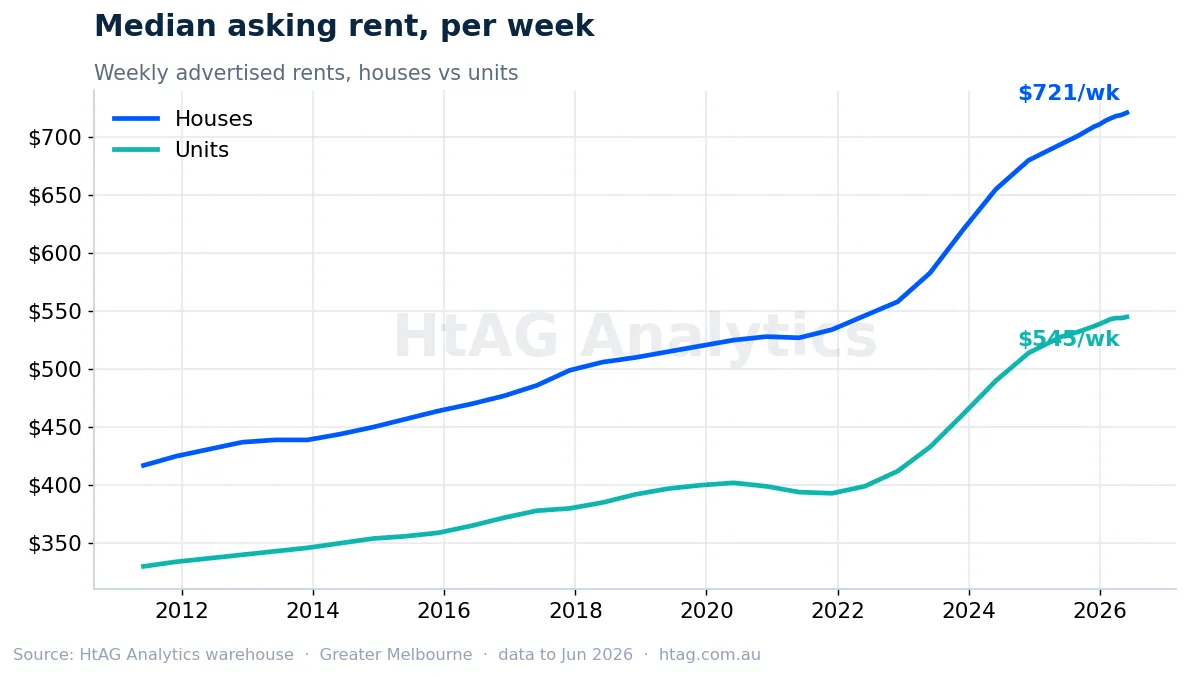
Rents keep climbing
House rents sit at $721 a week and unit rents $545, up +3.9% and +3.2% over the past year.
Over five years, Melbourne rents have jumped 37% for houses and 38% for units — a direct consequence of the tight vacancy shown below, and the main driver of the yield picture.
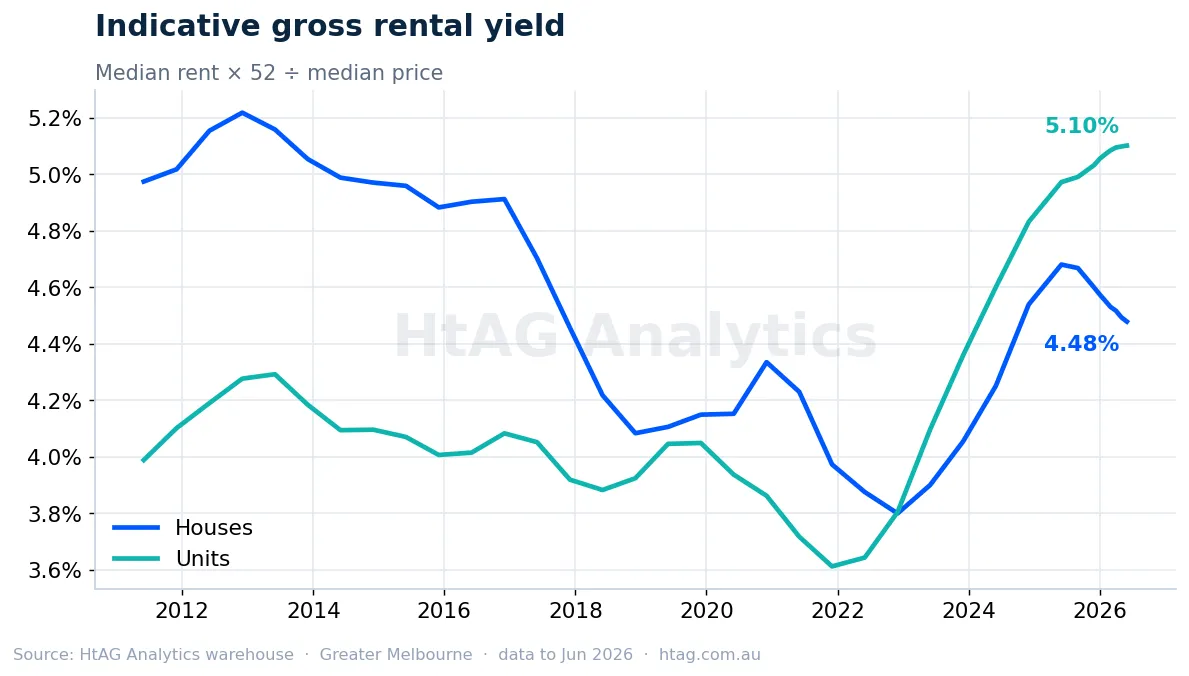
Rental yields
Gross rental yields in Melbourne are about 4.5% for houses and 5.1% for units. Units offer materially stronger cashflow — the trade-off for their slower capital growth.
For an investor servicing a loan at a 4.35% cash rate, the yield on offer is central to holding costs. See our guide to gross rental yield for how these figures are calculated.
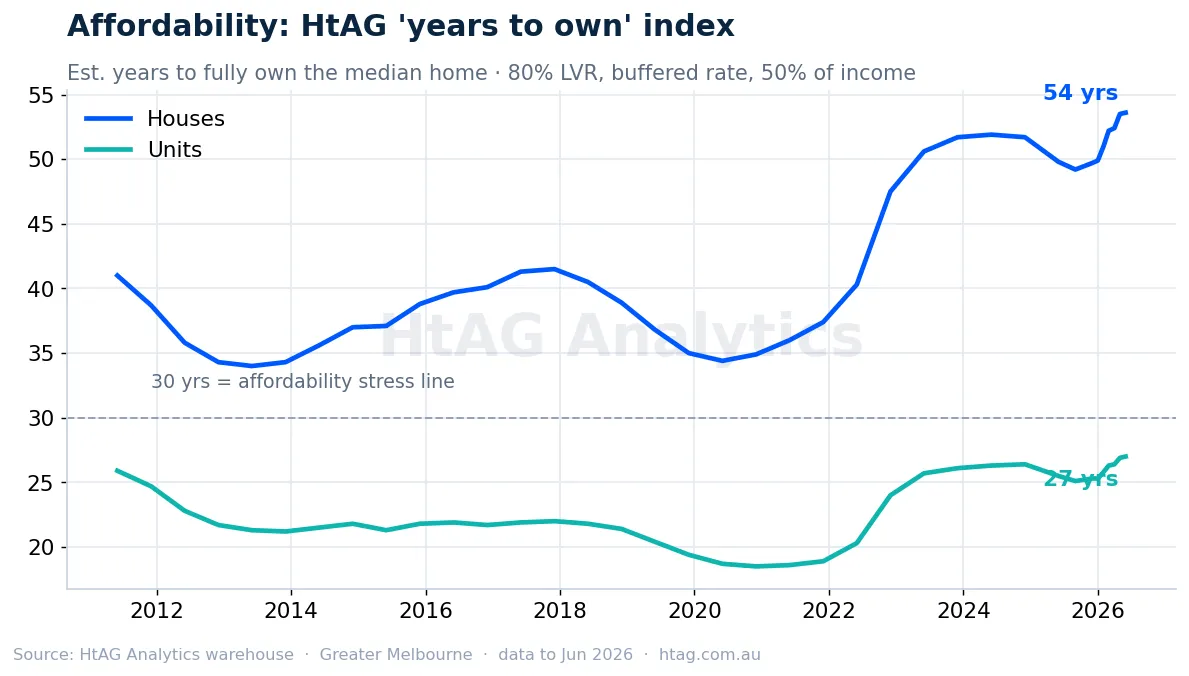
How affordable is Melbourne?
HtAG’s years-to-own affordability index estimates how long it would take to fully own the median dwelling (80% loan, a buffered rate, half of household income to repayments). Above 30 years signals affordability stress.
Melbourne houses sit near 54 years and units near 27 years. Affordability is stretched — well beyond the 30-year comfort line. Many buyers respond by rentvesting or using equity to get in.
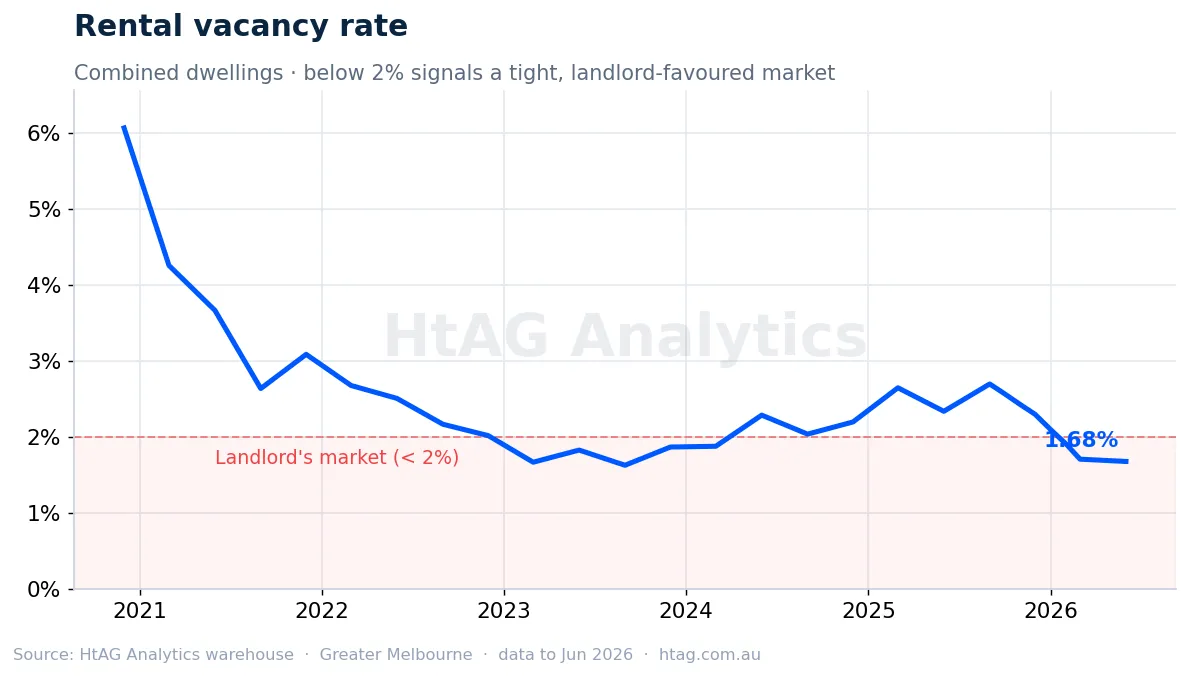
The rental squeeze
A balanced rental market sits near 3% vacancy. Melbourne is running at just 1.7% — well below the 2% balance line. You can compare vacancy rates by suburb across the country on HtAG.
When so few rentals are available, landlords hold pricing power — which is exactly why rents have run as hard as they have.
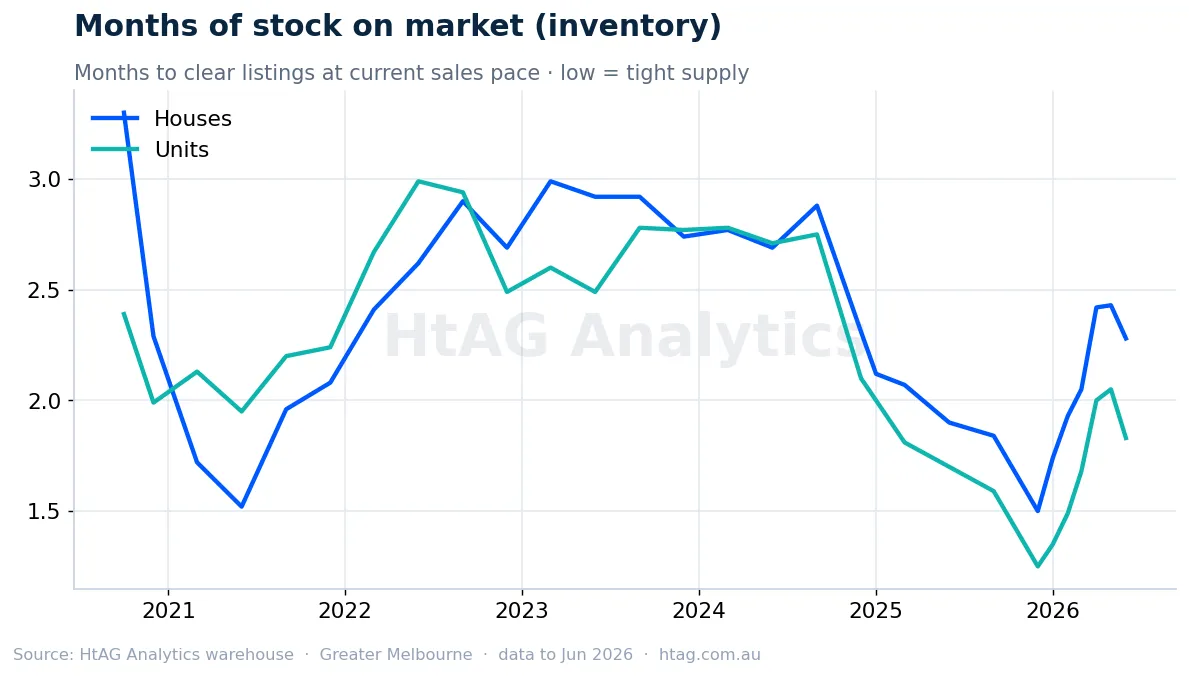
Supply on the market
Inventory is around 2.3 months for houses. Inventory measures how many months it would take to clear every current listing at the present sales pace. Under about three months favours sellers, and Melbourne has stayed tight through the recent cycle.
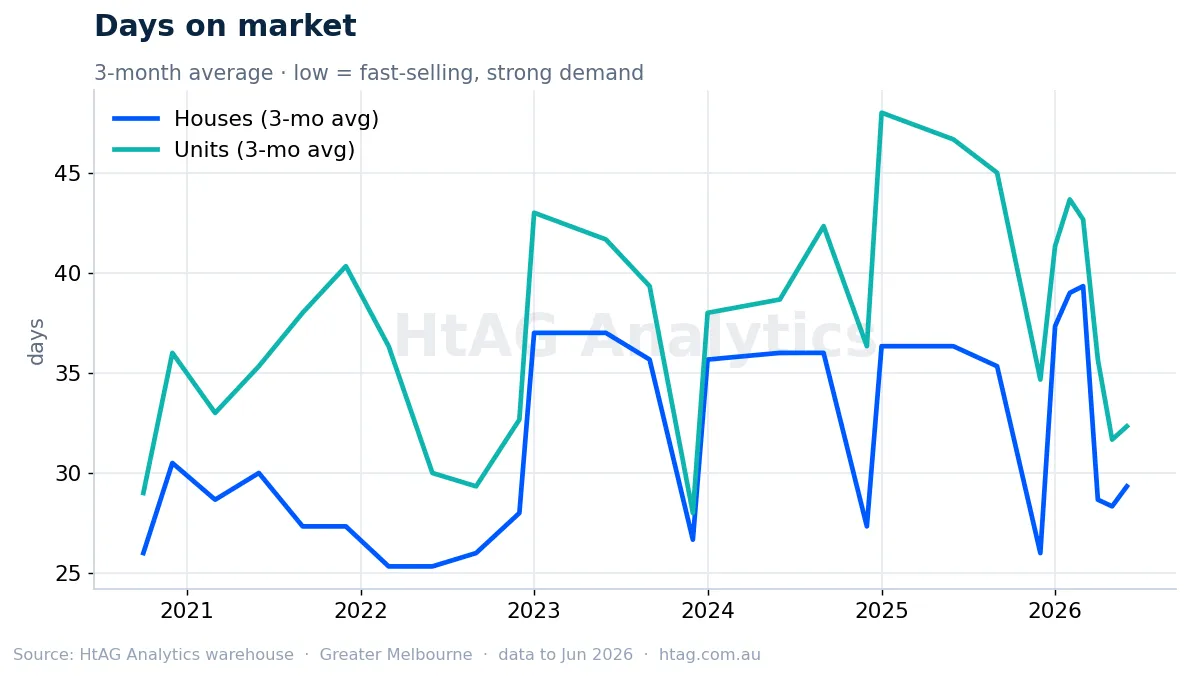
How fast homes are selling
Stripping out the January listing lull with a three-month average, houses are selling in about 29 days and units 32. Fast selling times are a clean, real-time read on buyer demand.
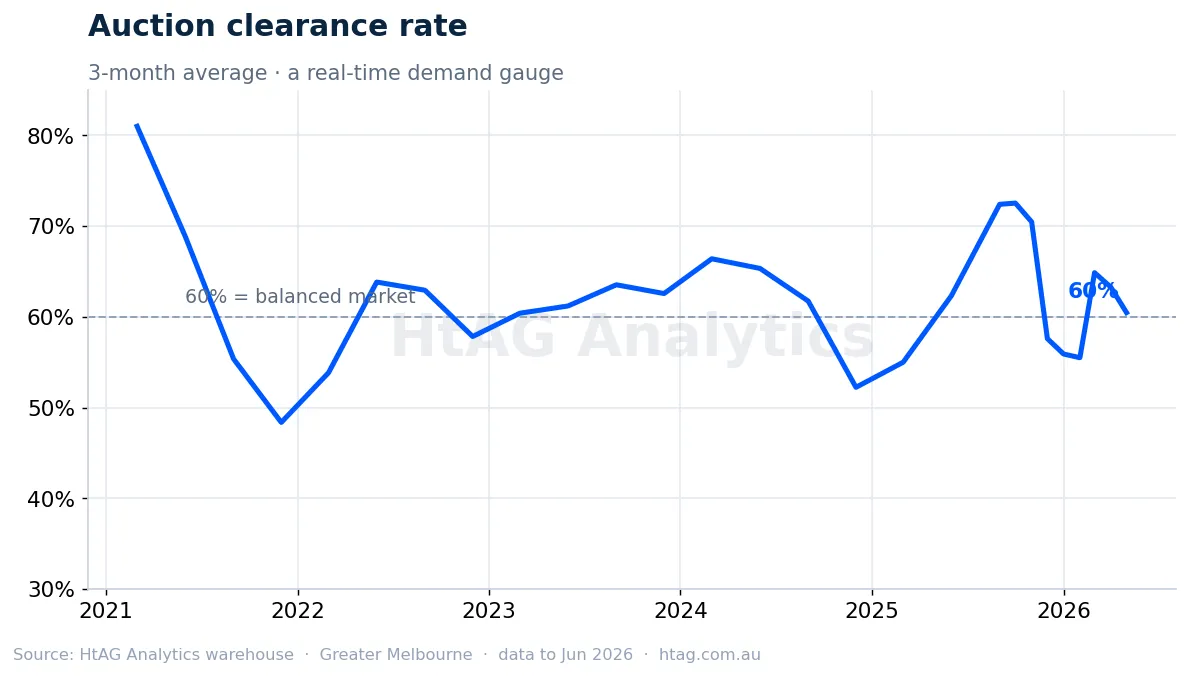
What auctions are telling us
Melbourne’s three-month-average auction clearance rate is running around 60% — steady demand. A rate in the low-60s is considered balanced; the high-70s signals a boom; the 40s a downturn.
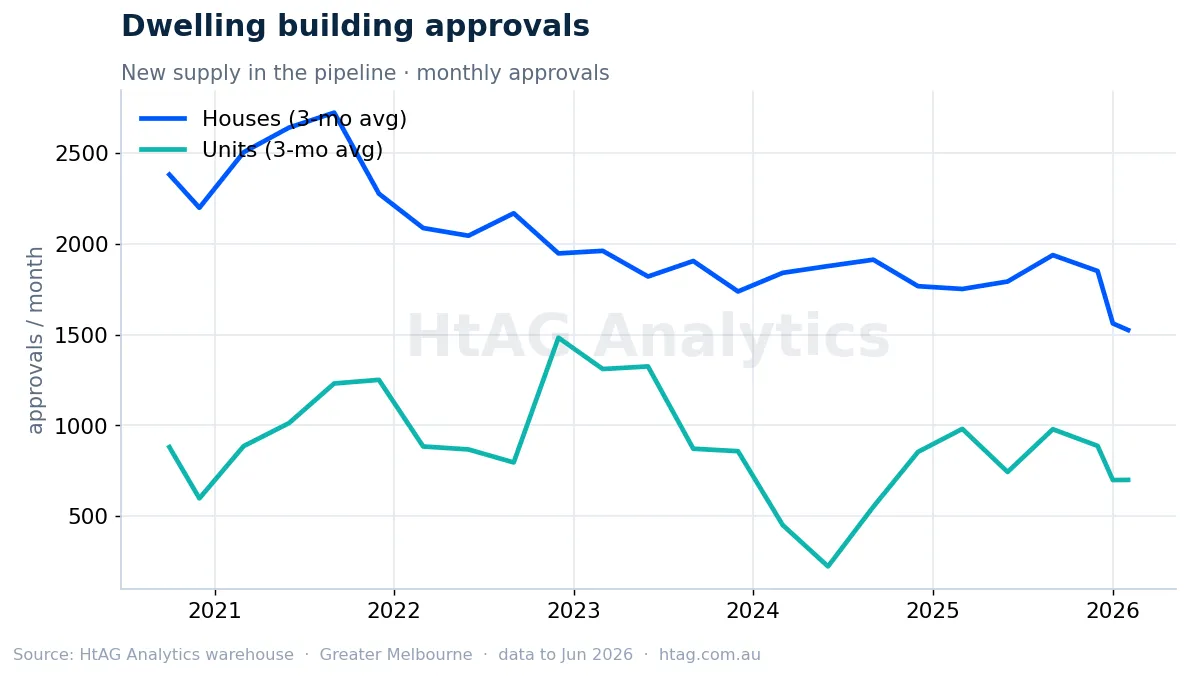
The construction pipeline
Building approvals are the leading indicator of future supply, and across Melbourne they remain short of what population growth requires.
Approvals take two to three years to become completed dwellings, so even a lift today would not relieve the current squeeze until the back half of the decade — which is why the supply-demand imbalance is likely to persist.
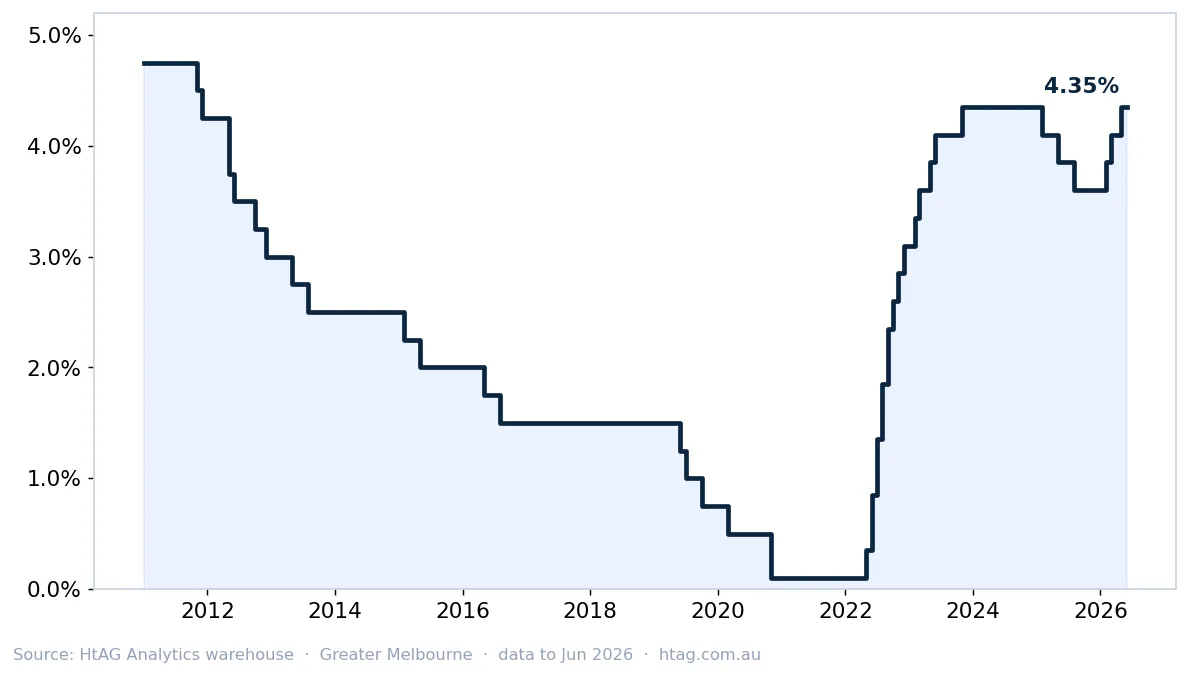
The tide underneath it all
Every trend above sits on top of interest rates. The RBA cash rate is currently 4.35%, after moving from an emergency low of 0.10% during the pandemic to 4.35%, and easing part-way back since.
Rate moves are the single biggest swing factor for Melbourne prices — they set borrowing capacity, and therefore what buyers can pay.
Melbourne property market outlook
Every pressure gauge on this page currently points the same way: vacancy at 1.7%, inventory near 2.3 months, homes selling in about 29 days, and a construction pipeline running short of population growth. Supply is scarce at both ends — rentals and listings — and scarcity supports prices.
The swing factor is the cash rate: it sets what buyers can borrow, and therefore what they can pay. HtAG models projected capital-growth ranges for every Melbourne suburb inside the platform — the citywide story above is the backdrop, but the opportunity and the risk are suburb by suburb. For the national picture, see HtAG’s Australian property forecast.
What it means for buyers, sellers and investors
Know the segment
The market is functional rather than frantic, giving disciplined buyers room to negotiate. Houses and units are behaving differently — choose the one that fits your goal, not just your budget.
Cashflow vs growth
With units yielding ~5.1% against sub-2% vacancy, the cashflow end of the Melbourne market is where the numbers work best; houses remain the long-run growth play. The best suburbs to invest in Victoria list and HtAG’s Relative Composite Score help rank the options.
Conditions favour you — for now
Tight supply and quick selling times keep sellers in a strong position, but rate moves can shift sentiment fast.
Scarcity, priced by rates
Melbourne’s tight rental market and constrained pipeline keep a floor under prices and rents; the cash rate decides how fast they move from here.
Melbourne property market FAQs
What is the average property growth rate in Melbourne?
On HtAG Analytics data to Jun 2026, Melbourne house values grew +8.6% over the past year, +29.2% over five years and +67.9% over ten years. Units grew +0.6%, +0.8% and +17.5% over the same periods. These are median-based figures — the change in the typical dwelling value, not a hedonic index.
What is the median house price in Melbourne in 2026?
The median Melbourne house value is about $837K and the median unit about $555K as at Jun 2026, on HtAG Analytics data covering the 31 Greater Melbourne metropolitan local government areas. A typical house now costs roughly 1.5 times a typical unit.
Is Melbourne a good place to buy an investment property in 2026?
It depends on the segment. Units yield about 5.1% gross against 1.7% vacancy — the cashflow end of the market — while houses (about 4.5% gross yield) have carried the long-run capital growth. Suburb selection matters more than the citywide average; HtAG’s Melbourne suburb dashboards break the same data down to every suburb.
What is the rental vacancy rate in Melbourne?
About 1.7% as at Jun 2026 on HtAG data — well below the ~3% balanced-market level. That tightness is why Melbourne rents have risen more than 37% for houses and 38% for units over five years. You can check vacancy rates by suburb on HtAG.
Will Melbourne property prices keep rising in 2026?
The current drivers point up: vacancy at 1.7%, inventory near 2.3 months, homes selling in about 29 days, and building approvals short of population growth. The cash rate is the swing factor — it sets borrowing capacity. See HtAG’s Australian property forecast for the national outlook.
How this analysis is built
- Coverage. “Greater Melbourne” here is HtAG’s metropolitan definition — the 31 Melbourne metro local government areas, from Wyndham and Melton in the west to the Yarra Ranges, Casey and the Mornington Peninsula. It reflects the commonly understood Melbourne metro area and approximates, rather than exactly matches, the ABS “Greater Melbourne” statistical area. Houses and units, current to Jun 2026.
- Source. The HtAG Analytics data warehouse — the same modelled series that power HtAG’s suburb and market tools. See how HtAG converts raw data into decision-grade signals.
- Growth is median-based. All growth figures are the change in the median (typical) dwelling value, not a hedonic index. Median-based growth can differ from hedonic indices (e.g. CoreLogic) because it also reflects changes in the mix of properties transacting.
- Values are HtAG’s index-smoothed typical/median dwelling values.
- Yields are indicative gross figures (median weekly rent × 52 ÷ median value) and exclude costs.
- Years-to-own is HtAG’s affordability index (80% LVR, buffered rate, 50% of income; above 30 = stretched).
- Vacancy, clearance, days on market, inventory and approvals are 3-month averages where noted, to smooth the January seasonal lull.
Surface this data inside your AI agent
Every figure on this page is available programmatically. Point your AI assistant, app or workflow at HtAG’s developer platform to pull Melbourne prices, rents, yields, vacancy and more as structured, up-to-date data. Explore the HtAG developer platform.
HtAG Analytics (2026). Melbourne Property Market 2026: Prices, Rents & Outlook. Greater Melbourne data to Jun 2026, updated quarterly. https://www.htag.com.au/melbourne-property-market-analytics/
Go beyond the citywide view
This is the Melbourne headline. HtAG Analytics breaks the same data down to every suburb and LGA — supply, demand, yield, affordability and forecast growth — so you can find the pockets that outperform the average.
Explore Melbourne’s investment suburbs →Disclaimer: This page is for educational purposes only and does not constitute financial advice. Property investment carries risks, and past performance is not indicative of future results. All growth rates, yields and projections are derived from historical data and statistical modelling. Always conduct your own due diligence and consult a qualified financial adviser before making investment decisions.
Understand the metrics
The figures on this page are explained in the HtAG Data Dictionary — plain-English definitions of every HtAG property metric:
Typical Price · Capital Growth · Gross Rental Yield · Vacancy Rate · Days on Market · Growth Rate Cycle · Relative Composite Score · Years to Own